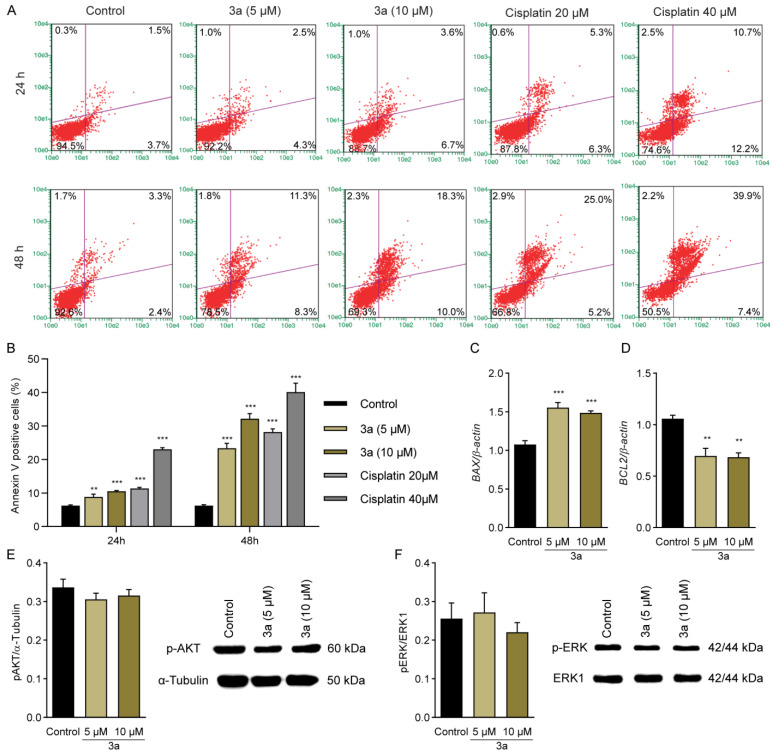
Figure 5.
Compound 3a induced apoptosis in SK-MEL-147 cells. (A,B) Representative dot plots and analysis of annexin V/7-AAD assay performed in SK-MEL-147 cells after 24 and 48 h of treatment with 3a. Viable cells (lower left quadrants), early apoptosis (lower right quadrants), late apoptosis (upper right quadrants), and necrotic cells (upper left quadrants); (C,D) Relative mRNA expression of BAX, respectively, determined by qPCR in SK-MEL-147 cells treated with 3a at 5 and 10 µM for 24 h; (E,F) Relative protein levels of p-AKT (E) and p-ERK (F) by immunoblot in SK-MEL-147 cells treated for 24 h with 3a at 5 and 10 µM. α-tubulin and ERK-1 were used as a loading controls; ** p < 0.01 and *** p < 0.001 according to ANOVA followed by Dunnet post-test compared with control group.

