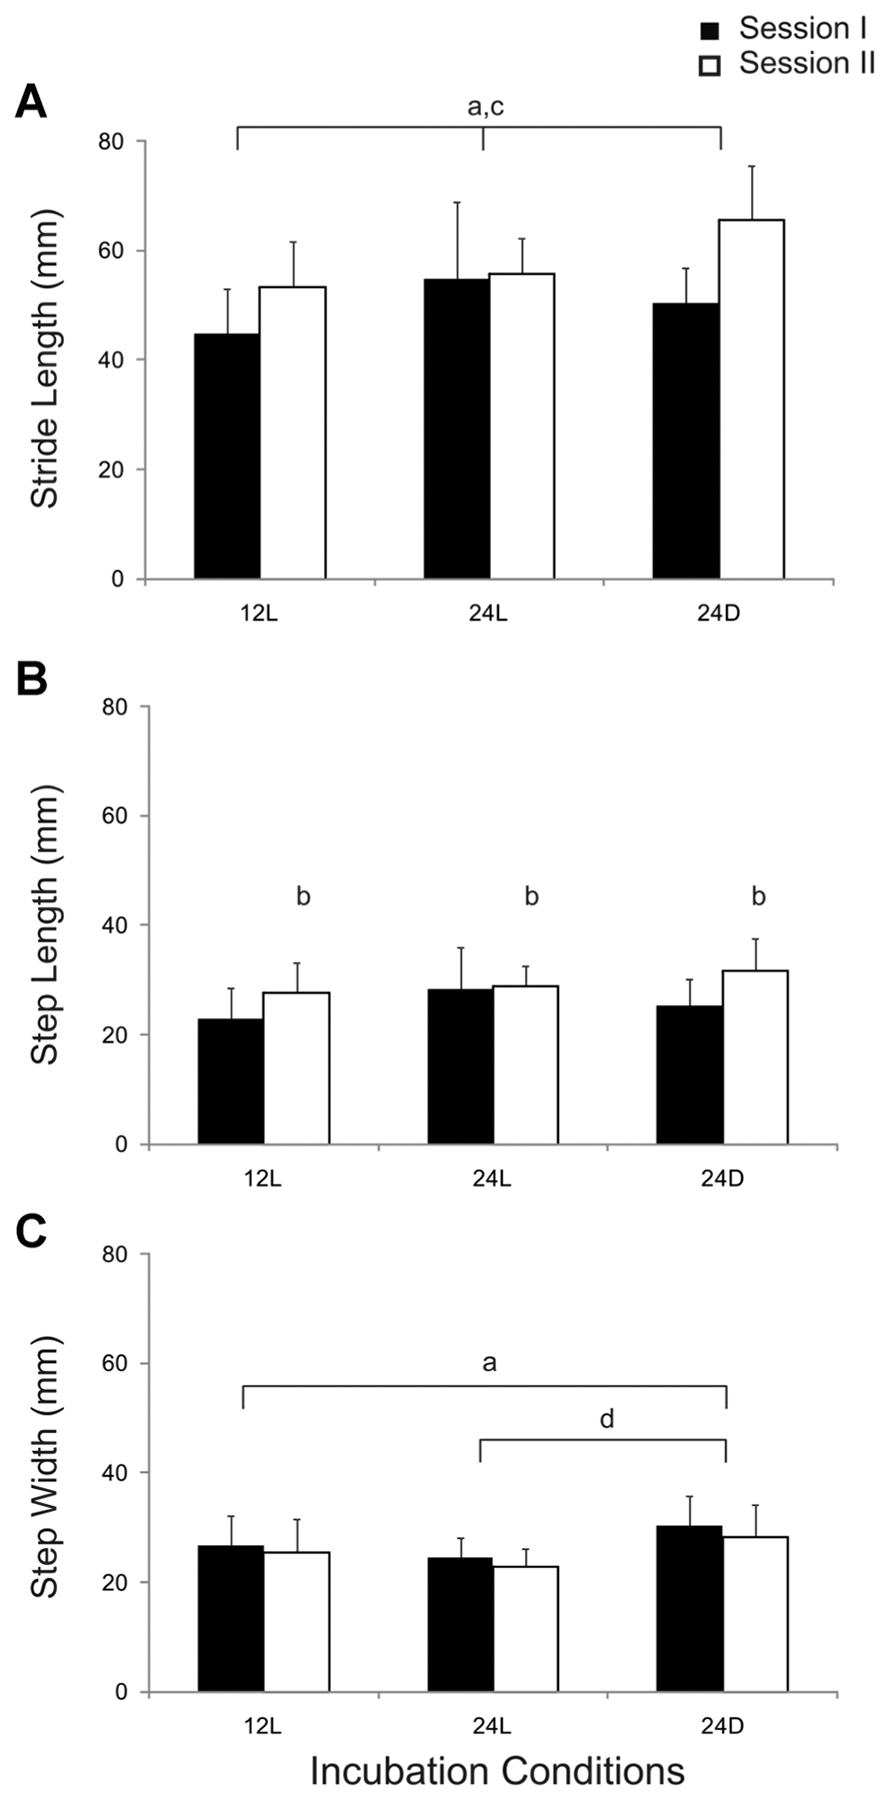
FIGURE 2.

Comparison of spatial parameters for locomotion across incubation conditions during test sessions I and II. Group means (N = 10) and SD are shown. Significant differences are indicated by lower case letters: across incubation conditions (a), between sessions (b), and post hoc comparisons for 12L versus 24D (c), and 24L versus 24D (d).
