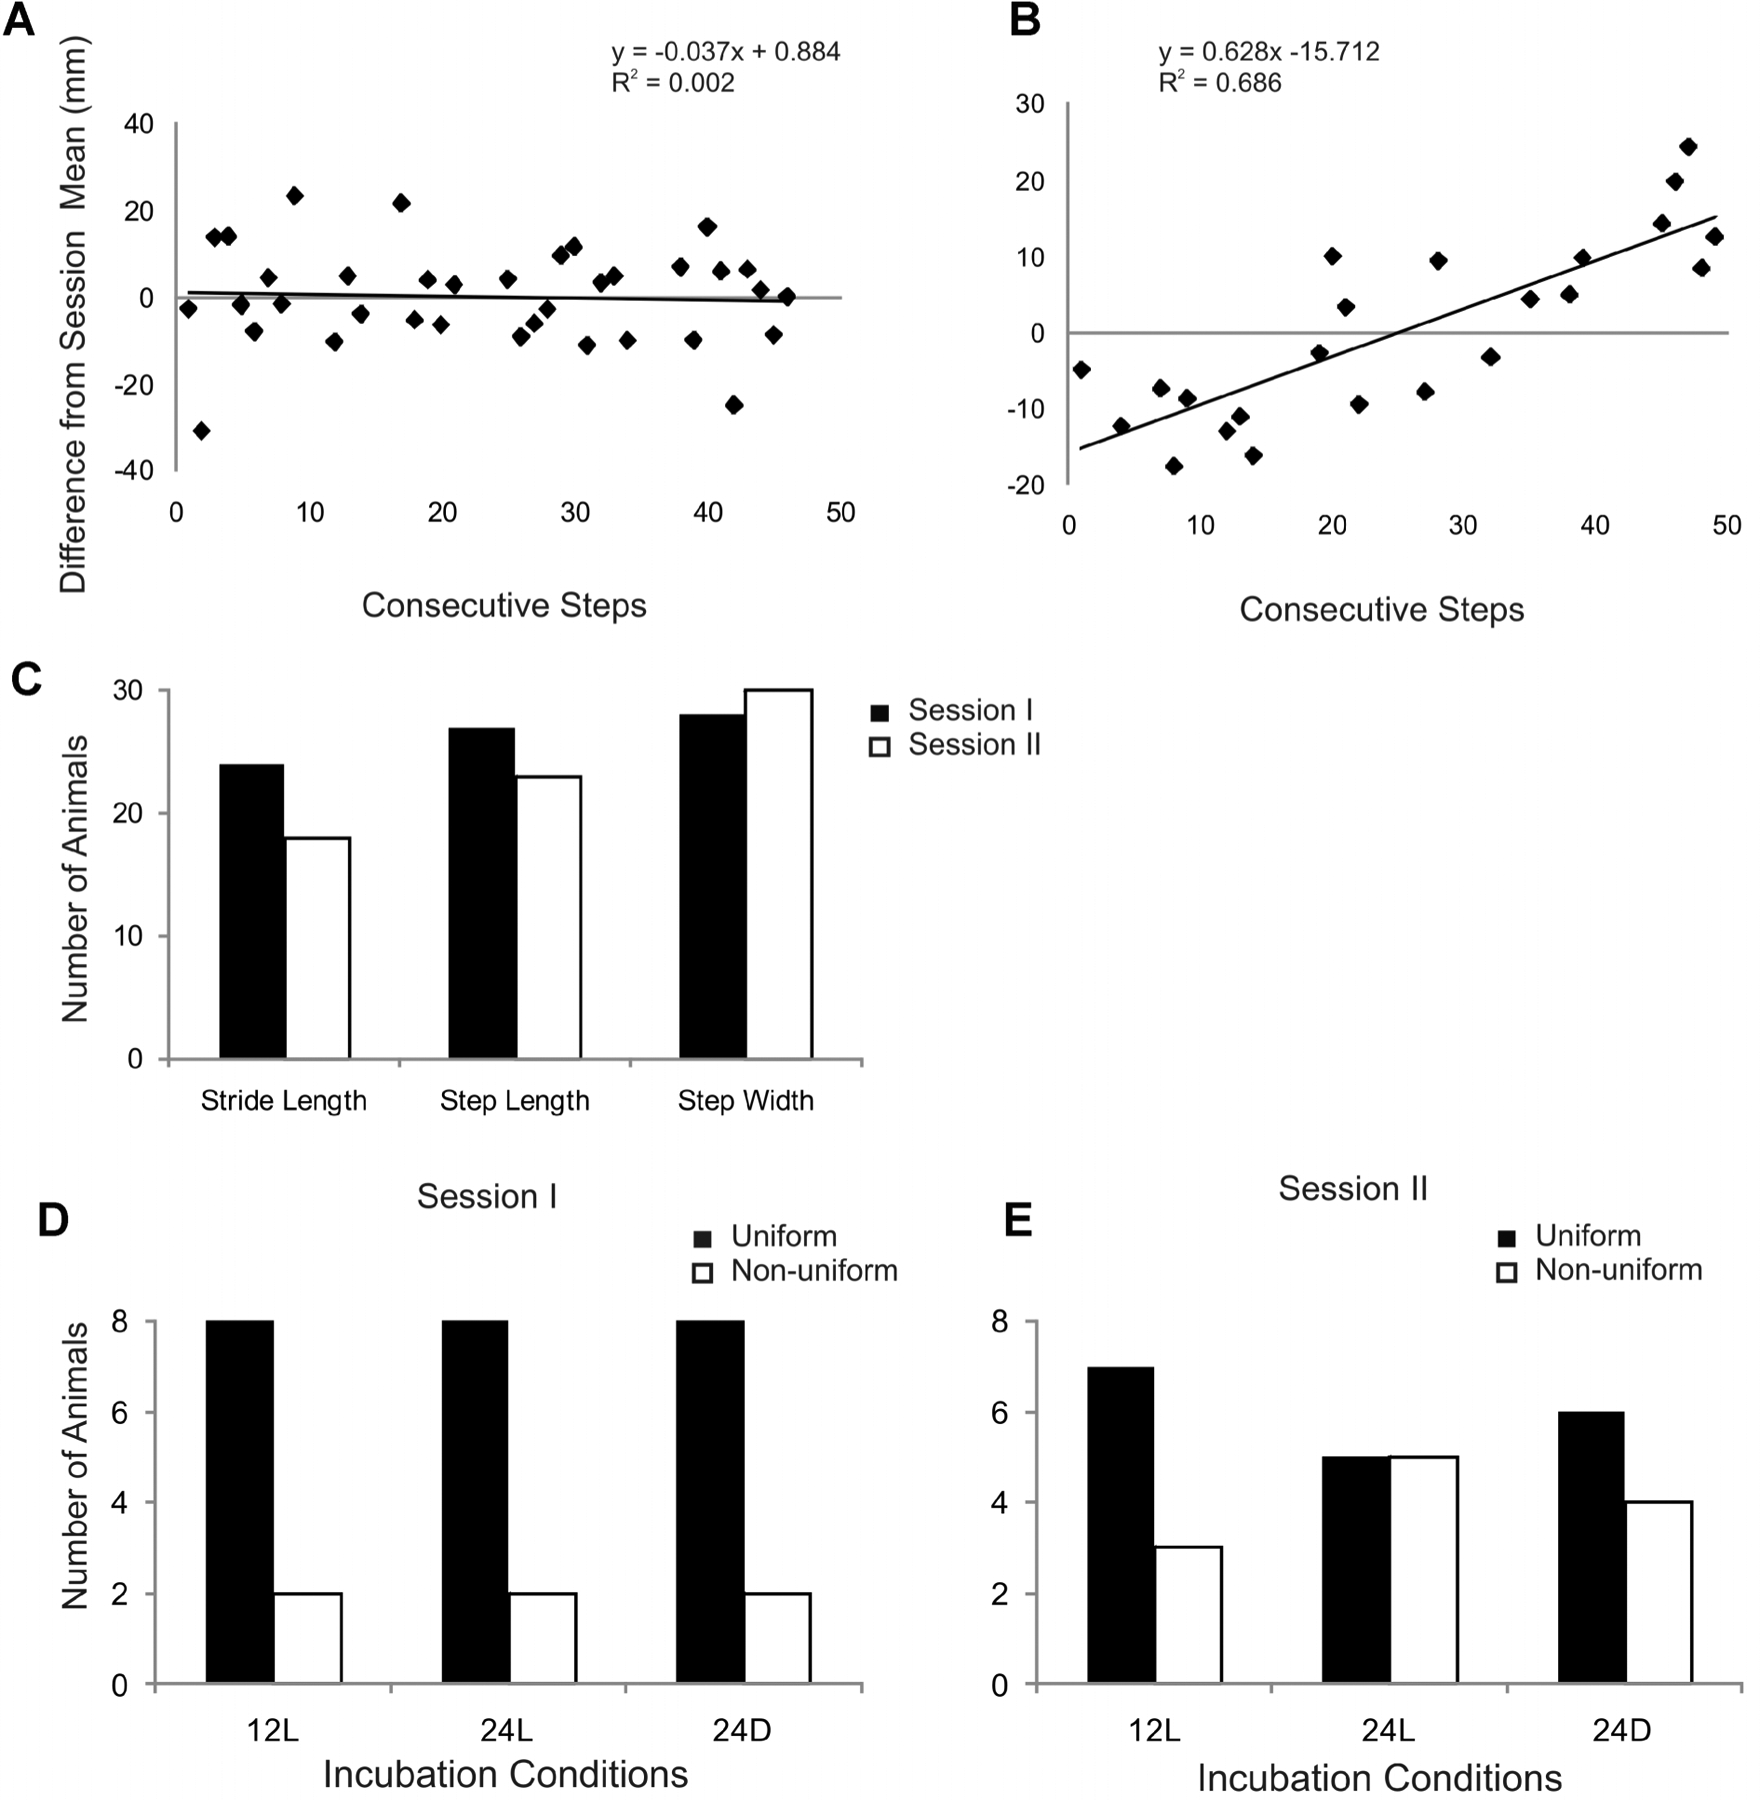
FIGURE 3.

Analyses for step-to-step variability in spatial parameters. (A) Variability in stride length for consecutive steps during walk trials 1–4 in session I are shown for a chick incubated in 12L conditions. Variability was similarly distributed across steps relative to the chick’s session mean (0 mm). (B) Stride length variability in session I for a chick incubated in 24L conditions. Variability shifted across steps relative to this chick’s session mean. (C) Bar graphs indicate the number of animals that exhibited a uniform distribution pattern of step-to-step variability (e.g., A) for each spatial parameter during sessions I and II. (D and E) Bar graphs indicate the number of animals that exhibited a uniform or nonuniform distribution (e.g., B) for stride length in session I(D) and session II (E).
