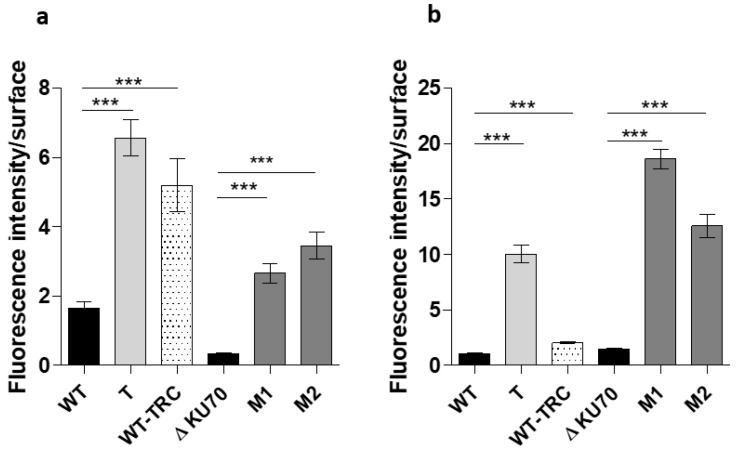
Figure 4.
Analysis of the fluorescence labelling of conidia surface carbohydrates with FITC-conjugated lectins. (a,b) Fluorescence intensity of (a) ConA binding to mannosyl and glucosyl residues and (b) WGA binding to N-acetylglucosamine (NAG) residues on the surface of the conidia. Fluorescence analysis was performed using ImageJ (Fiji) software from at least 200 conidia. The graph is representative of three independent experiments. Significant differences are indicated: *** p < 0.001 (Kruskall-Wallis test). T: transformant derived from the WT strain; M1 and M2: transformants derived from the ΔKU70 strain.

