Figure 5.
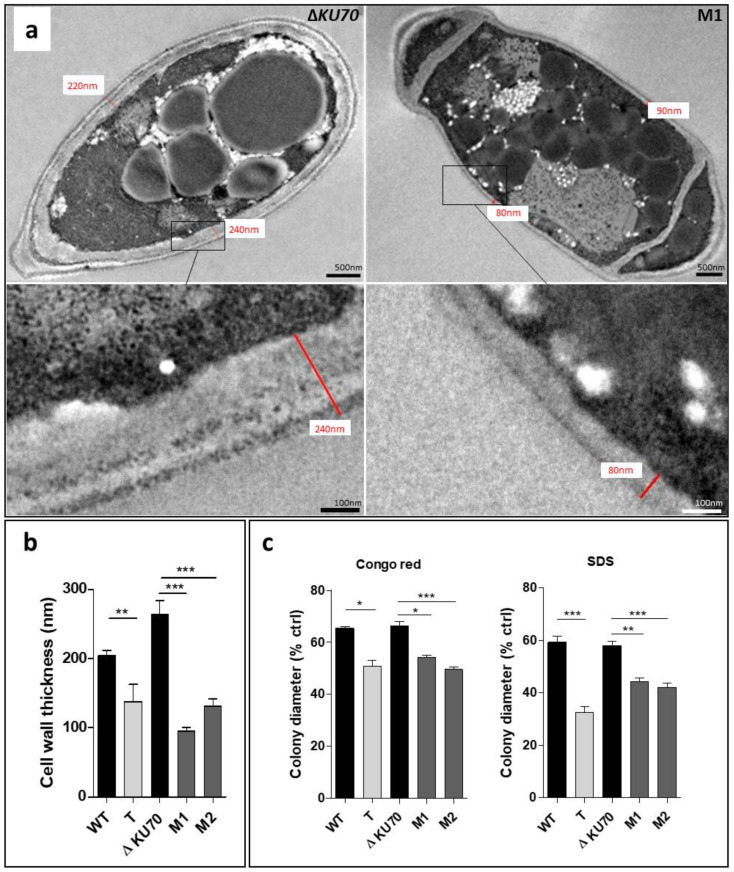
Evaluation of cell-wall thickness and integrity. (a) TEM of ΔKU70 and M1 conidia cell walls. The image is representative of the three transformants. (b) Thickness determined from transmission electron microscopy (TEM) acquisition for 20 acquisitions. (c) Growth in contact with the cell-wall chemical stressors Congo Red and SDS. After an incubation of seven days at 30 °C, the colony diameter was measured and expressed according to the control growth on stress-free PDA. All graphs include results obtained from three independent experiments. Significant differences are indicated: * p < 0.05, ** p < 0.01, *** p < 0.001 (Kruskall-Wallis test). T: transformant derived from the WT strain; M1 and M2: transformants derived from the ΔKU70 strain.

