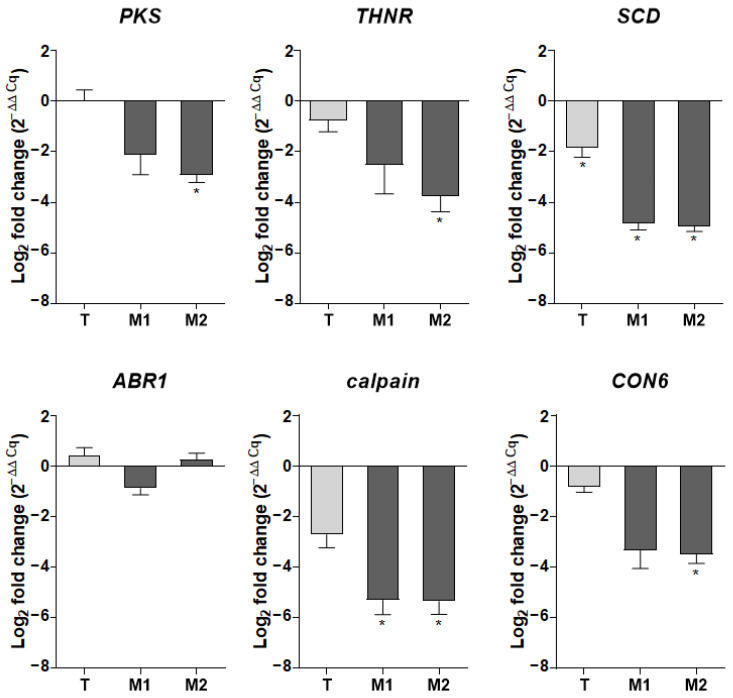
Figure 10.
Fold-induction mRNA values for a selected panel of genes in the T, M1, and M2 strains relative to their parental ΔKU70 strain. Expression levels of target genes were normalized against the expression of the S. apiospermum UBC6 and FIS1 housekeeping genes. Results are expressed as 2−ΔΔCq, referring to the fold induction in the T, M1, and M2 strains relative to the mean quantification cycle obtained with the parental strains. Data are from four biological replicates: * p ≤ 0.05 (Mann-Whitney test). T: transformant derived from the WT strain; M1 and M2: transformants derived from the ΔKU70 strain.

