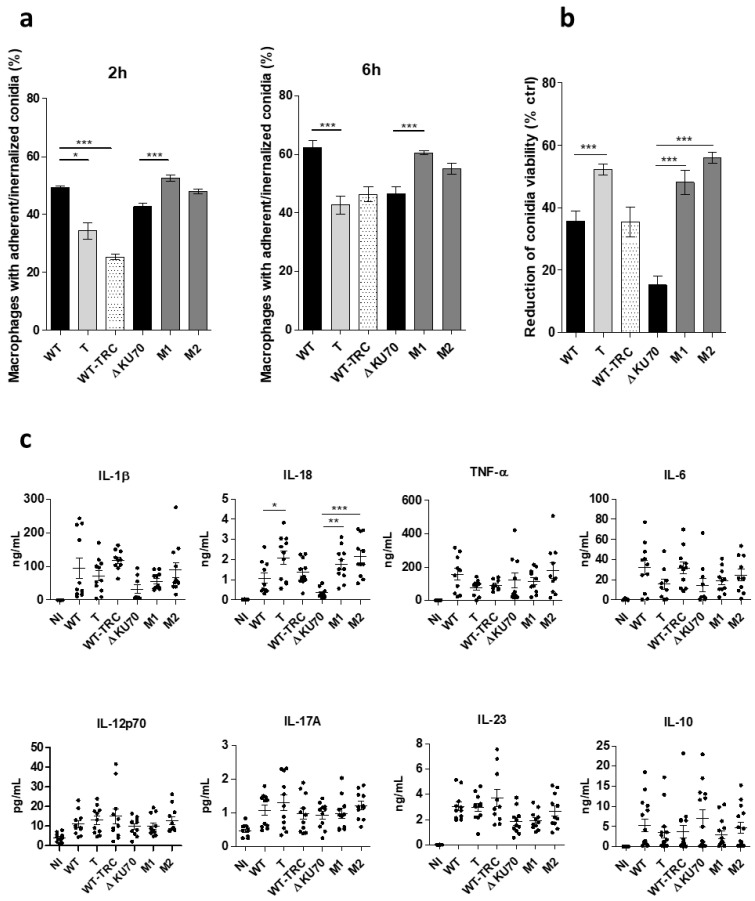
Figure 11.
Phagocytosis, killing, and cytokine release from human macrophages infected with T, M1, and M2 conidia. (a) Percentage of macrophages with adherent or ingested conidia after 2 or 6 h of incubation with FITC-stained conidia (MOI 5:1) at 37 °C in 5% CO2. Graphs present the percentage of FITC+ CD11b+ events among CD11b+ cells (macrophages). (b) Conidia killing after ingestion by macrophages. After 6 h of incubation (MOI 1:1), extracellular conidia were removed by three PBS washes and internalized conidia were released by macrophage lysis (cold water). The graph presents the decrease in conidia viability among ingested conidia relative to the viability of conidia not exposed to macrophages (live control). Conidia viability was determined as the percentage of FITC+ PI– events among FITC+ events (total conidia). The reduction in conidia survival was calculated relative to control conidia as: 100 × ((% of live conidia among control conidia − % of live conidia among cell-exposed conidia)/% of live conidia among control conidia). (c) Cytokine release in culture supernatants from macrophages incubated with conidia for 12 h (MOI 10:1). Concentrations were determined using a 13 plex-bead-based LEGENDplex® multianalyte flow assay. A non-infected (NI) condition was included in each experiment. Data are from three independent experiments. * p < 0.05, ** p < 0.01, *** p < 0.001 (Kruskall-Wallis test) T: transformant derived from the WT strain; M1 and M2: transformants derived from the ΔKU70 strain.

