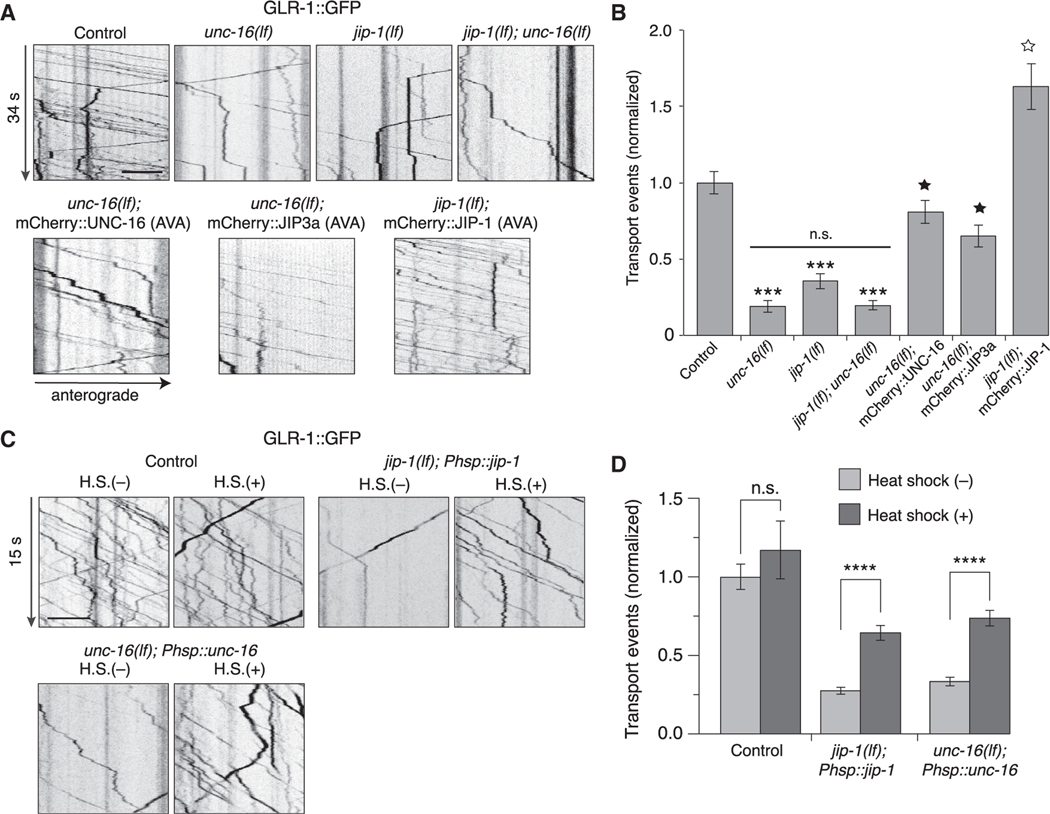
Figure 1. GLR-1 transport is reduced in unc-16 and jip-1 scaffold-protein mutants.
(A) Kymographs of GLR-1::GFP transport in the AVA processes of transgenic control worms, unc-16(e109) and jip-1(km18) single and double loss-of-function (lf) mutants, and transgenic mutants that expressed either mCherry::UNC-16, mCherry::JIP-1, or mCherry::JIP3a in AVA.
(B) Total (anterograde and retrograde) GLR-1::GFP transport events in control worms (n = 15), unc-16(lf) (n = 12), jip-1(lf) (n = 14), jip-1(lf); unc-16(lf) (n = 9), unc-16(lf); mCherry::UNC-16 (n = 14), unc-16(lf); mCherry::JIP3a (n = 7), and jip-1(lf); mCherry::JIP-1 (n = 10) (normalized to control). ***Significantly different from control, p < 0.001. Filled star, significantly different from unc-16(lf), p < 0.001. Open star, significantly different from jip-1(lf), p < 0.001. Horizontal bar indicates unc-16(lf) and jip-1(lf) were not significantly different from each other or from jip-1(lf); unc-16(lf) double mutants.
(C) Kymographs of GLR-1::GFP transport in transgenic control worms (without Phsp::jip-1 or Phsp::unc-16), and transgenic jip-1(lf) and unc-16(lf) that expressed either Phsp::jip-1 or Phsp::unc-16, respectively, and either with or without 1 h of heat shock (H.S.) at 32°C. Phsp represents the hsp16–2p heat-shock promoter.
(D) Total GLR-1::GFP transport events in control worms without (n = 16) or with (n = 5) heat shock, jip-1(lf); Phsp::jip-1 without (n = 30) or with (n = 26) heat shock, and unc-16(lf); Phsp::unc-16 without (n = 28) or with (n = 27) heat shock (normalized to control without heat-shock treatment). ****p < 0.0001. n.s., not significant. All statistical comparison used a Kruskal-Wallis test with Dunn’s multiple comparison.
All strains carried the glr-1(ky176) deletion mutation (see STAR Methods). Scale bars, 5 μm. Error bars represent standard error of the mean (SEM). See STAR Methods for a description of statistical analysis. See also Figures S1–S3, Tables S1, and S2.

