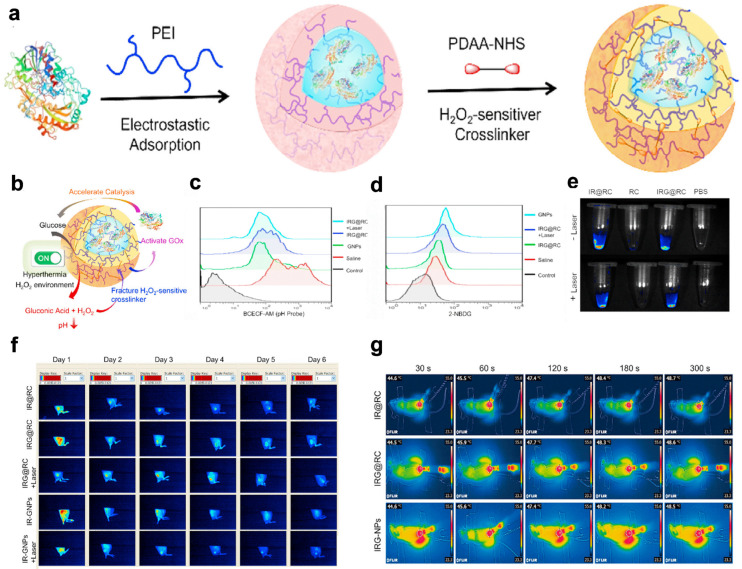
Figure 6.
GNPs for FLI and infrared thermography. (a) Fabrication process of GNPs. (b) Schematic illustration of the catalytic activity of GNPs. (c,d) H2O2 content in tumor tissue determined with an H2O2 detection kit. Flow cytometry images of the pH probes BCECF-AM © and 2-NBDG (d) to determine the cellular pH value and glucose consumption, respectively. (e) Ex vivo fluorescence images of RC, IR@RC, and IRG@RC with/without laser irradiation. (f) In vivo fluorescence images of tumor-bearing mice. (g) Thermal imaging at the tumor site after laser irradiation by in vivo infrared thermography. Reproduced with permission from Ref. [108]. Copyright © 2022 The Authors. Published by Elsevier Ltd.

