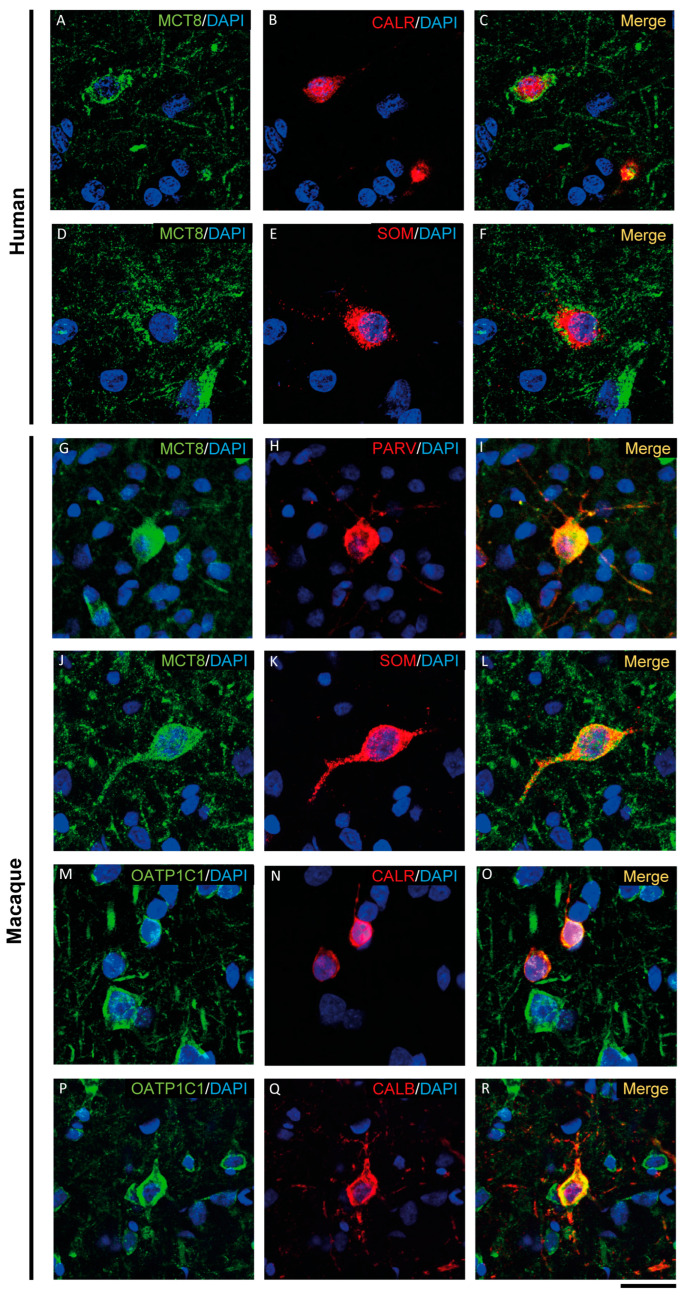
Figure 6.
Expression of MCT8 and OATP1C1 in different subpopulations of GABAergic interneurons. Representative confocal microscope images of human (A–F) and macaque (G–R) cortical sections double-stained for MCT8 or OATP1C1 and several interneuronal markers. (A–C) Coexpression of human MCT8 (green) with CALR (red). (D–F) Coexpression of human MCT8 (green) with SOM (red). (G–L) Colocalization of macaque MCT8 (green) with PARV (red, G–I) and SOM (red, J–L). (M–R) Colocalization of macaque OATP1C1 (green) with CALR (red, M–O) and CALB (P–R). Counterstaining with DAPI (blue) shows nuclei of all cells. CALB: Calbindin-D-28K, CALR: calretinin, PARV: parvalbumin, SOM: somatostatin. Scale bar = 50 μm.

