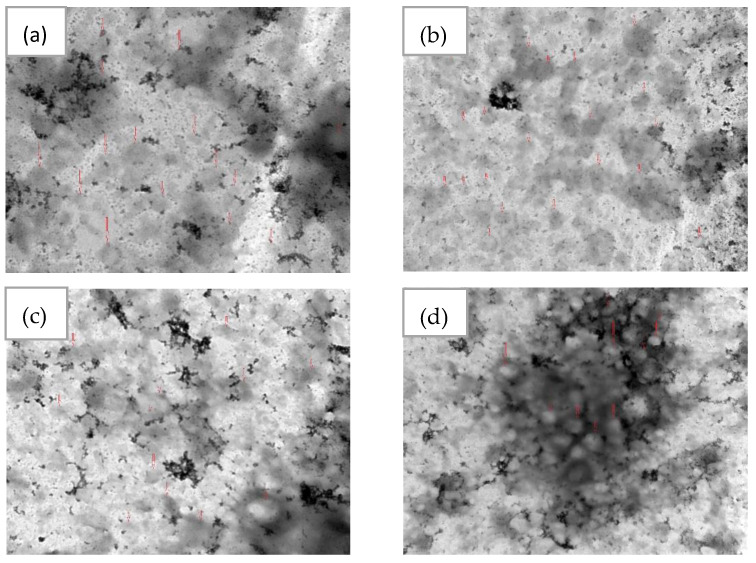
Figure 7.
TEM images of the optimum EGCG nano-liposomes: (a) 80 K magnification; the scale bar represents 200 nm; (b) 50 K magnification; the scale bar represents 500 nm; (c) 40 K magnification; the scale bar represents 500 nm; (d) 25 K magnification; the scale bar represents 1000 nm. The red arrows show examples of liposome particles.

