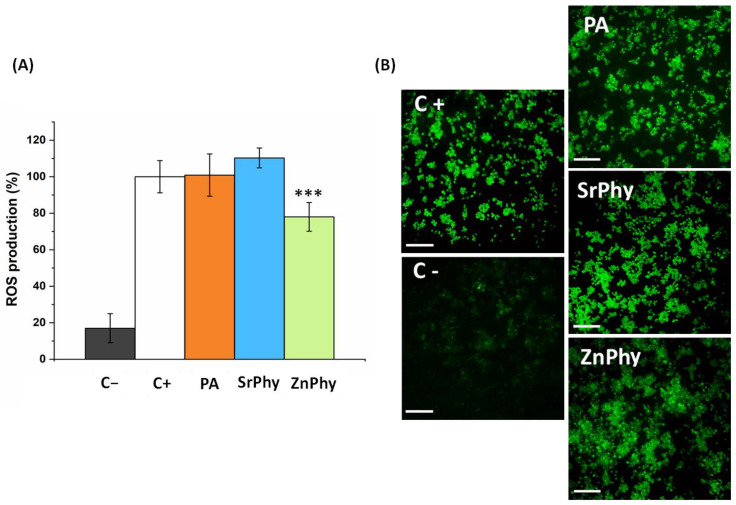
Figure 4.
(A) Quantitative analysis of ROS production by RAW264.7 cultures. The results were expressed relative to the positive control, which was referred to as 100% ROS production. An ANOVA test was performed between samples at the significant level *** p < 0.001 (Tukey’s test). (B) Fluorescence microscopy images were obtained for positive and negative controls (left), and PA, SrPhy and ZnPhy samples (right). Scale bars correspond to 100 µm. The positive control refers to cells stimulated with H2O2 and the negative control corresponds to untreated cells. The results are presented as the mean ROS production (%) ± SD (n = 8).

