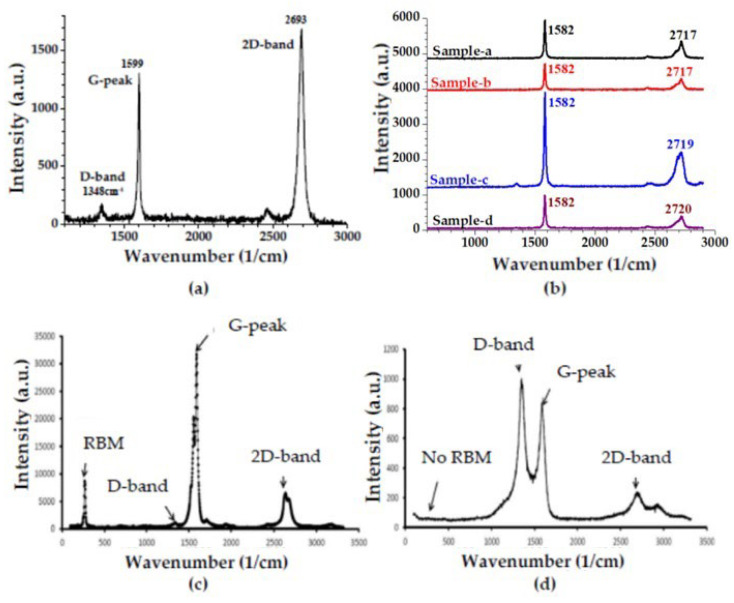
Figure 9.
Raman spectrum of (a) single-layer graphene, (b) many-layer graphene, (c) SWCNTs and (d) MWCNTs. Subfigures (c,d) have been adapted from [123] with permission from Springer Nature. Subfigure (b) has been adapted from [118] with permission from MDPI. (Raman Spectroscopy experiments are performed in Universidad del Pais Vasco/Euskal Herriko Unibertsitatea—UPV/EHU laboratories, Bilbao, Spain. In Raman analysis in Figure (a), λexc = 532 nm).

