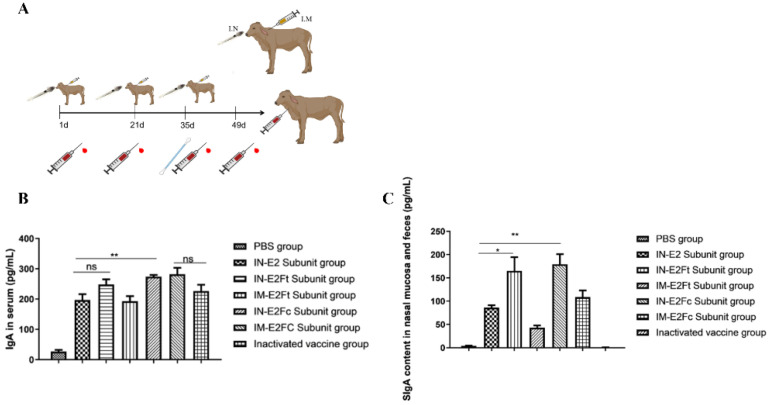
Figure 3.
The calf immunization experiments flow chart and mucosal and humoral immune responses induced by E2Fc in vivo. (A) BVDV subunit vaccine construction and calves immunization experiment flow chart. (B,C) The measurement of (B) IgA and (C) secretory IgA levels in the nasal swabs, feces, and serum samples collected on day 14 after secondary immunization by ELISA. n = 5, * p < 0.05, and ** p < 0.01.

