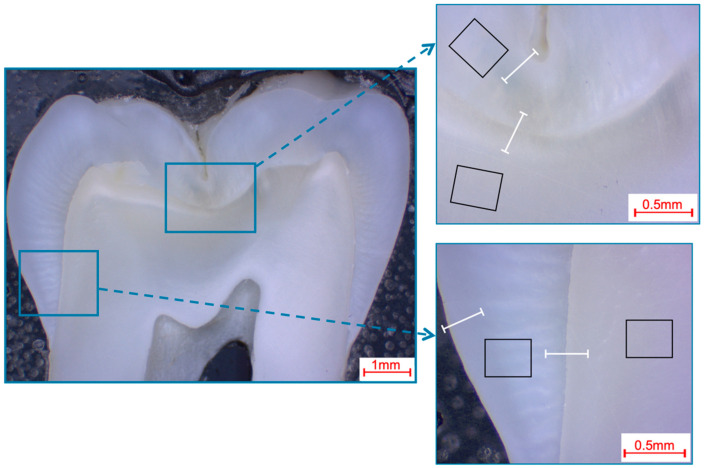
Figure 4.
Selection of fields and line scans for the elemental analysis in human third molars shown in a photo-microscopic overview. The black rectangles indicate the areas of the 366 µm × 291 µm field scans, while the white lines indicate the approximately 360 µm paths of the line scans. The upper right picture shows the fissure area, while the bottom right picture shows the approximal area.

