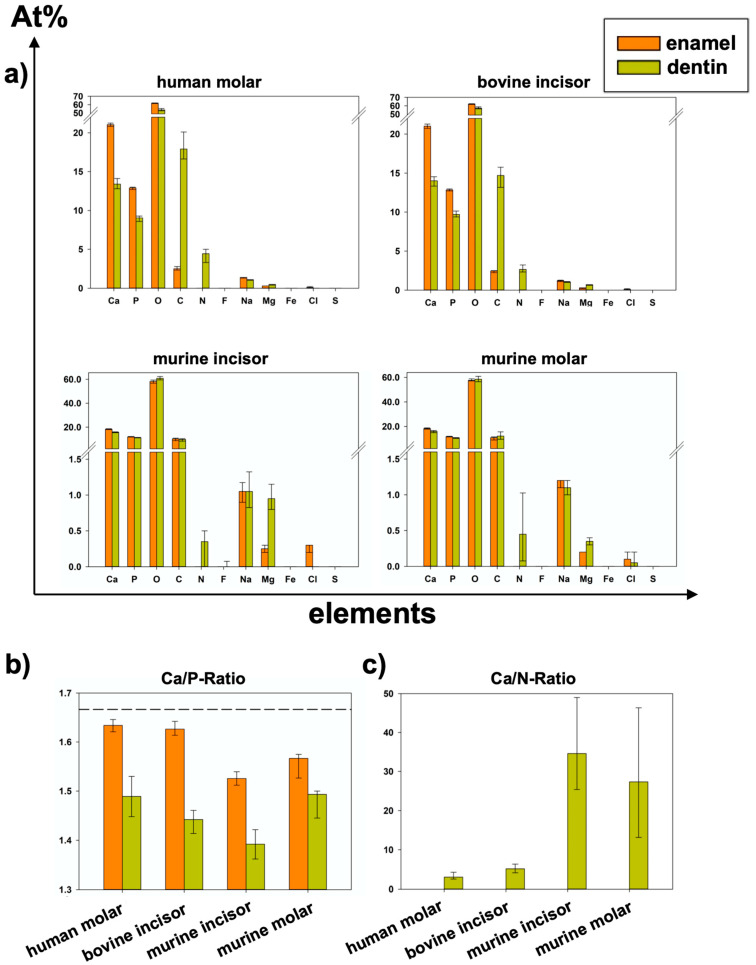
Figure 5.
(Data also shown in Table 1; p-values in Table 2 and Table 4): (a) Elemental composition of summarized areas for each group of teeth separated by enamel or dentin (median and 25–75% percentiles). (b) Ca/P-Ratio of all specimens (median and 25–75% percentiles); dashed line shows stoichiometric ratio (1.667) of hydroxy apatite. (c) Ca/N-Ratio of all specimens (Median and 25–75% percentiles); Because At%N > 0 was only detected in dentin areas, Ca/N-Ratio could not be calculated for enamel.

