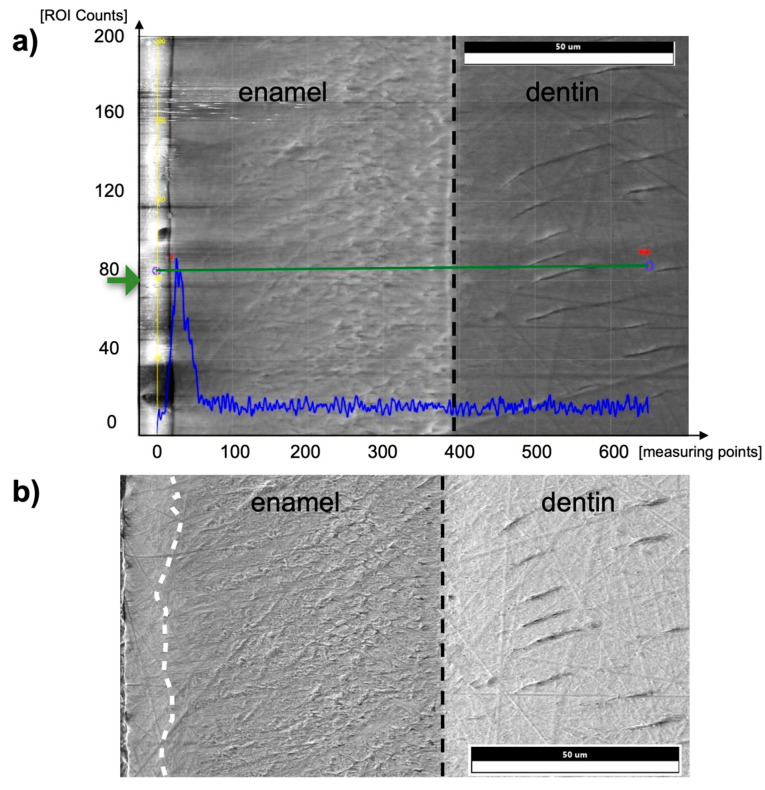
Figure 8.
(a) EDX line scan from the tooth surface (left edge, enamel) into the dentin on a murine incisor in the post-eruptive area. The black dashed line indicates the enamel-dentin junction. The blue graph shows the counts in iron at the respective positions of the measuring line shown in green. (b) SEM image of a specimen of a murine incisor. The superficial 10 µm of enamel (left margin, separated by a white dashed line) shows a brighter texture than below the surface, and thus, a different micromorphology and presumably an aprismatic structure compared to the prismatic inner enamel.

