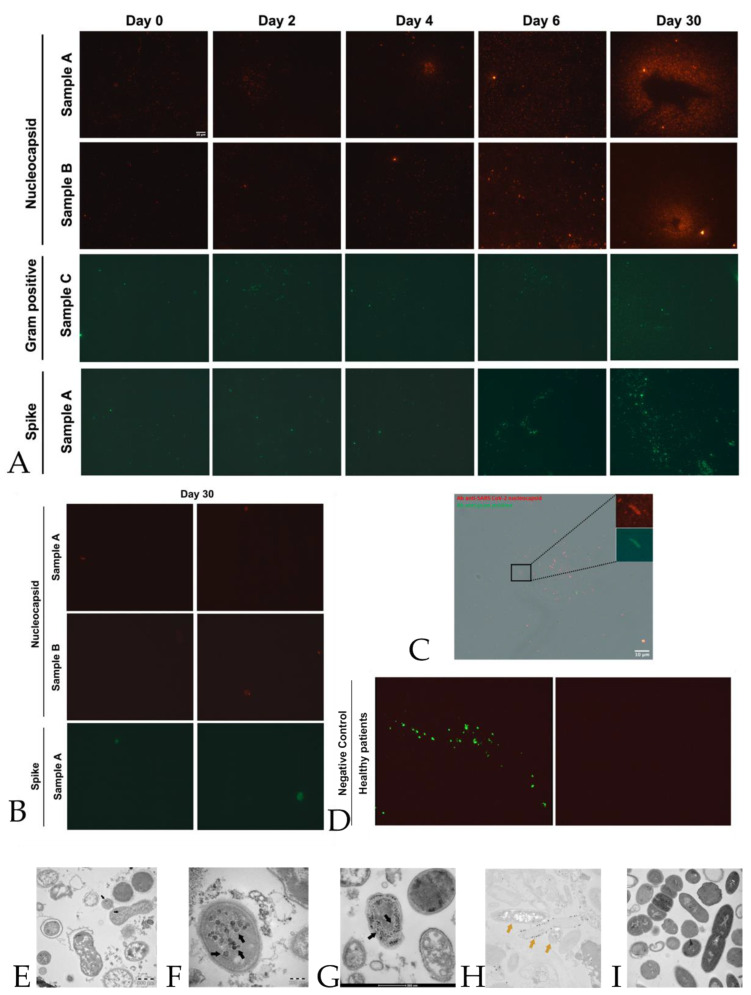
Figure 2.
Quantification of SARS-CoV2 peptides by immunofluorescence. Panel A: Representative panels show immunofluorescence of one sample among the ten samples A, B, and C of nucleocapsid, gram-positive, and spike proteins at 0, 2, 4, 6, and 30 days. Scale bar, 10 μm. All the cases are presented in supplementary materials in Figures S1 and S2. Panel B: Negative control of immunofluorescence of samples A and B at day 30 for nucleocapsid and spike proteins. Samples were incubated only with a secondary antibody; subsequently, no protein signal was detected. Panel C: A gram-positive bacterial culture from a SARS-CoV-2 positive individual, after 30 days, enlarged and fluorescent to nucleocapsid protein. Scale bar, 10 μ. Panel D, left side: shows the negative control immunofluorescence of healthy individuals (negative on nasopharyngeal swab with real-time RT-PCR) with no detection of infected SARS-CoV-2 bacteria (control on proteomic analysis and Luminex assay), as described in Materials and Methods (Section 4). In particular, the merge of gram-positive bacteria (green) and no signal for nucleocapsid proteins (red background) is visible. Panel D, the right side, represents the same image as the left side but with only the red background shown. Panel E–G: Transmission electron microscope images (panels A and B, TEM FEI, Thermo Fisher Tecnai G2 operating at 120 kV) show SARS-CoV-2 (indicated by black arrows) inside a bacterium. The proteomic profile at mass spectrometry confirms the presence of an abundance of SARS-CoV-2 proteins, together with the Luminex assay test, in the cultures of bacteria under study. Panel H,I: Immunogold labeling technique at transmission electron microscope on the same samples with anti-nucleocapsid protein of SARS-CoV-2 antibody (golden arrows); the gold particles are inside the bacteria, and no presence in bacteria from healthy individuals (Panel I). See more details in Materials and Methods (Section 4).

