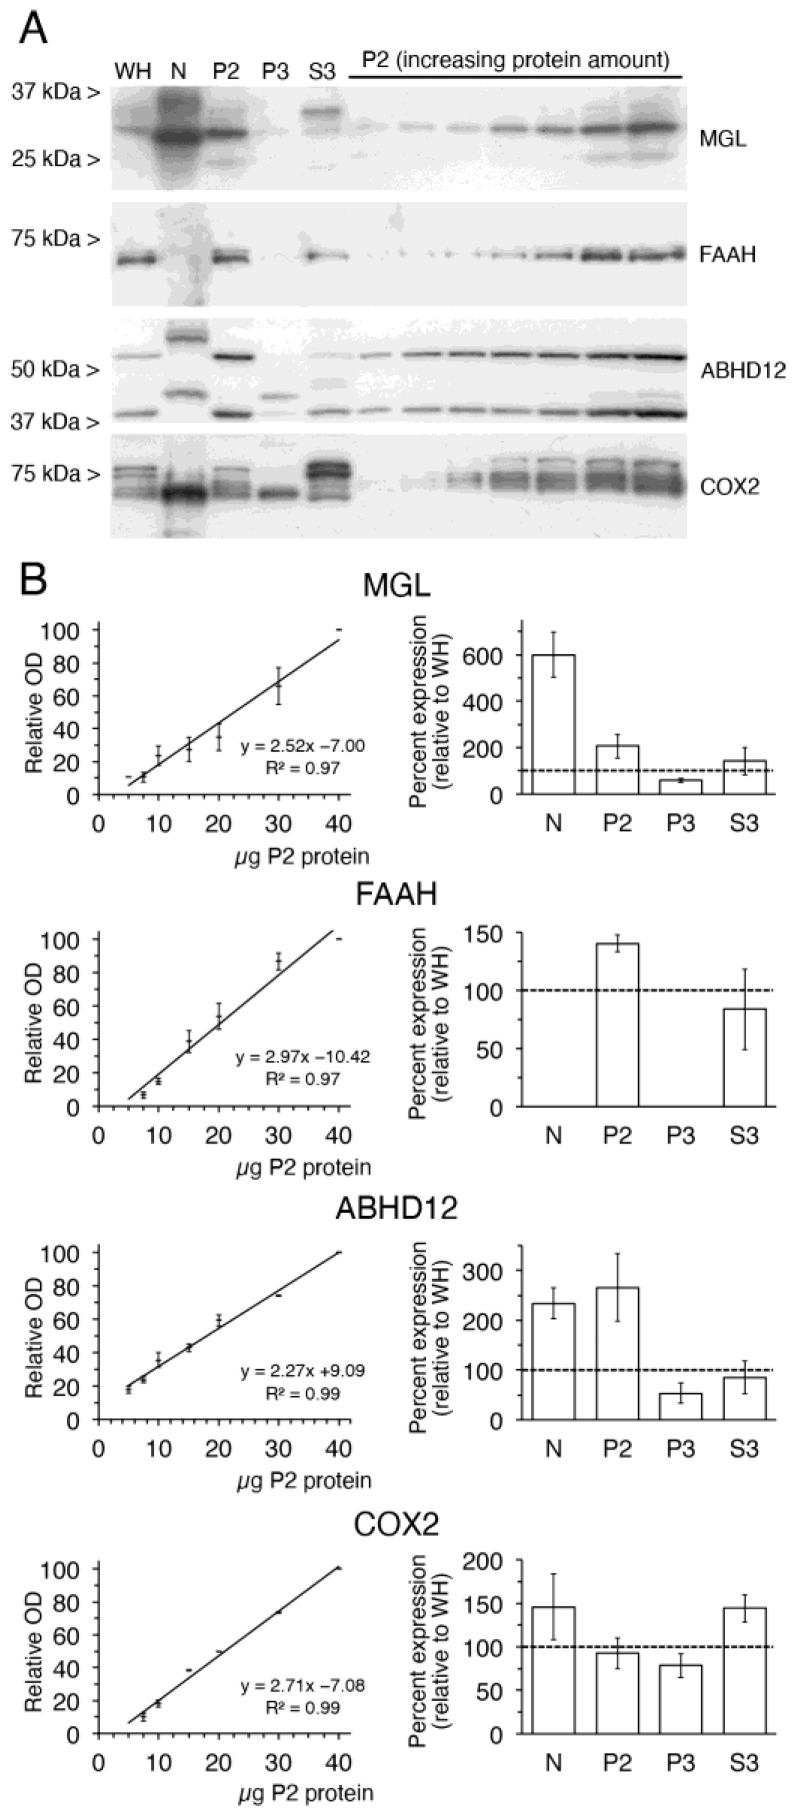
Figure 5.
Analysis of the subcellular expression of 2-AG metabolizing enzymes monoacylglycerol lipase (MGL), fatty acid amide hydrolase (FAAH), α/β hydrolase domain-containing protein 12 (ABHD12) and cyclooxygenase-2 (COX2). (A) Representative immunoblots of whole homogenate (WH) intact nuclear (N), plasma membrane (P2), microsomal (P3) and cytosolic (S3) fractions obtained from homogenates of the adult rat brain cortex. 20 µg protein from each fraction were loaded in the same gel. Incremental amounts of P2 membranes ranging from 5 to 40 µg protein were also run in parallel to generate reference standard curves used for semi-quantitative densitometric analysis of protein expression. (B) Graphs on the left correspond to standard curves of MGL-, FAAH-, ABHD12- and COX2-immunoreactivity in P2 samples. All optical density (OD) values were normalized to the value obtained at the highest protein loading. The correlation coefficients obtained by linear regression analysis are shown. Bar graphs on the right show results of the semi-quantitative analysis of MGL, FAAH, ABHD12 and COX2 protein expression in N, P2, P3 and S3 fractions. Values correspond to the percentage of the expression found in WH (100%, dashed line). Data presented are means ± SEM of four independent experiments (n = 4), except for FAAH (n = 2).

