Figure 1.
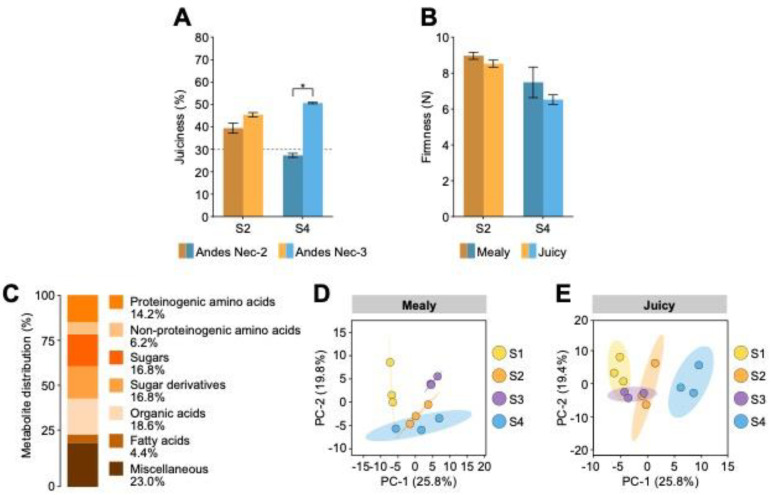
Nectarine phenotyping and global metabolite analysis. (A) Juiciness percentage in ripe fruits from Andes Nec-2 and Andes Nec-3 varieties. (B) The firmness of ripe fruits from the mealy and juicy varieties. Error bars represent SEM (n = 9). Data were tested by t-test (* p < 0.05). (C) Distribution of identified metabolites by GC-MS. Principal Component Analysis (PCA) of metabolites from S1, S2, S3, and S4 stages. Score plots of the mealy metabolite dataset (D) and the juicy metabolite dataset (E) consisting of three biological replicates (n = 3).

