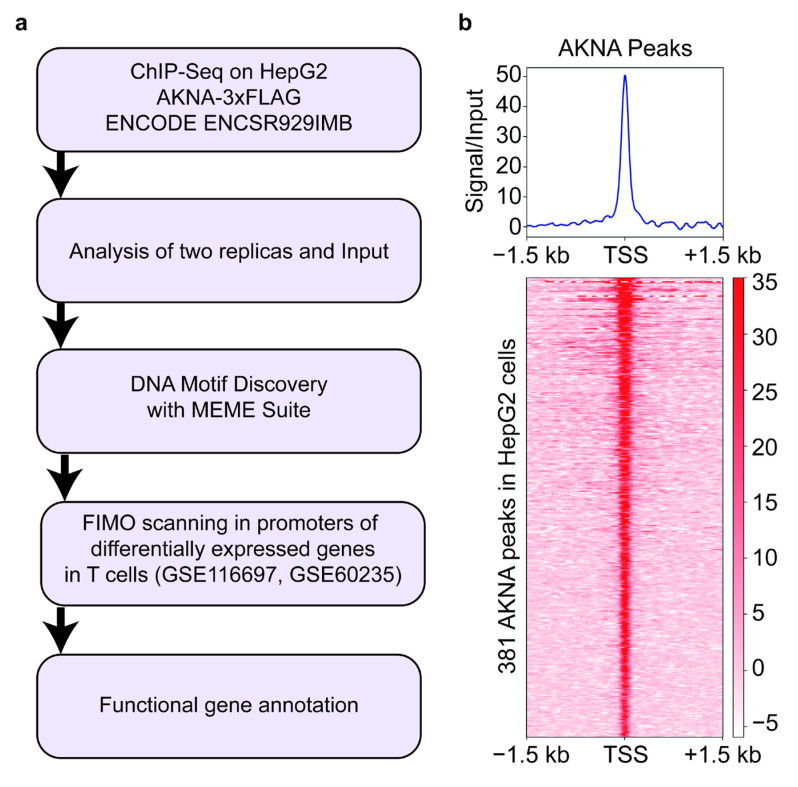
Figure 1.
Genomic regions enriched with AT-rich motifs in “AKNA flag HepG2 cells”. (a) Flowchart of the methodology for the prediction of AKNA transcription factor binding motifs. (b) Heat map of the regions enriched with AT-rich motifs; the signal intensity in red shows the area with the highest enrichment of AT-rich motifs. To validate the presence of homogeneous enriched zones, the graph shows a single peak of AKNA. Peaks detected in the HepG2 cell line are statistically significant (p < 0.05).

