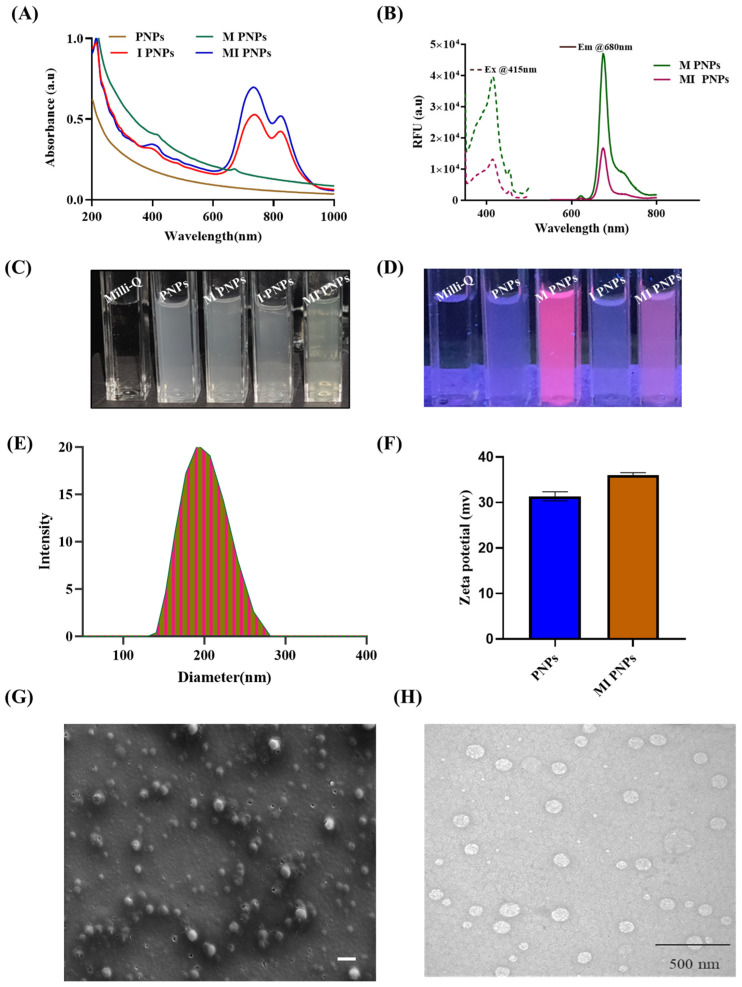
Figure 1.
Characterization of the MI PNPs. (A) UV-Vis spectra of the blank, M, I, and MI PNPs. (B) Fluorescent spectra of the M and MI PNPs (ex/em: 415/680 nm). (C,D) Representative images of the various PNPs under bright and UV light. (E,F) DLS and zeta potential graphs for the MI PNPs. (G,H) SEM and TEM images of the MI PNPs.

