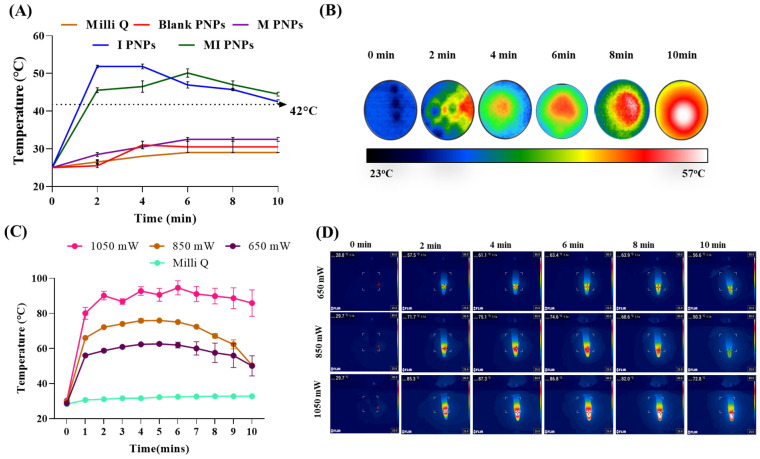
Figure 2.
Photothermal transduction efficacy studies of the MI PNPs during exposure to NIR 808 nm light. (A) Line graph indicating the temperature profiles of the various PNPs and controls. (B) Representative thermal images indicating the temperature increments. (C) Line graph indicating the temperature profiles of the various PNPs and controls for different power intensities of the NIR light. (D) Representative thermal images indicating the temperature increments for different power intensities of the NIR light.

