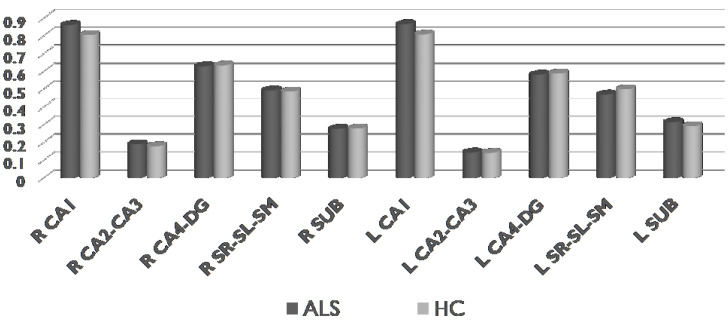
Figure 5.
Comparisons of the volumes of the hippocampal subfields in ALS and HC (Mann-Whitney U-test, Monte Carlo method, sampling n = 30,000). ALS = amyotrophic lateral sclerosis, HC = healthy controls, R = right, L = left, CA = cornu ammonis, DG = dentate gyrus, SR-SL-SM = strata radiatum-lacunosum-moleculare, SUB = subiculum.

