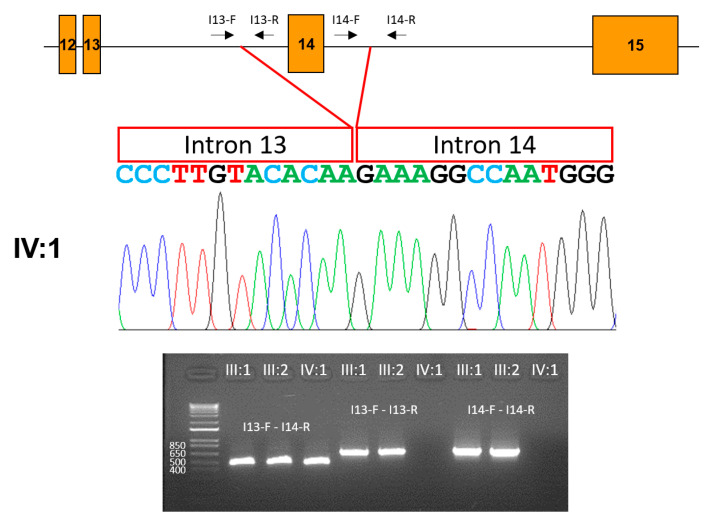
Figure 8.
Characterization of the deletion. A partial gene diagram is shown at the top. Exons are indicated with orange boxes, and exon numbers are in the boxes. Introns are shown as horizontal lines. Locations and directions of the primer binding sites are shown above the introns. Deletion points are indicated with red lines. The sequencing chromatogram of the proband is shown in the middle. The intron 13 and 14 sequences are shown as boxes above the nucleotide sequences. The agarose gel image is shown at the bottom. PCR reaction with I13-F and I14-R results in a 475 bp band from the mutant allele but a 4169 bp band from the wild-type allele. PCR amplifications within intron 13 (I13-F and I13-R, 656 bp) and 14 (I14-F and I14-R, 711 bp) did not produce PCR bands from the proband.

