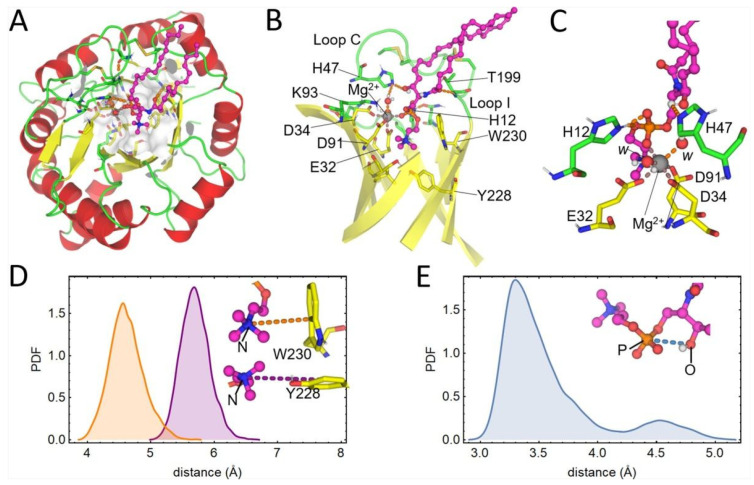
Figure 7.
Results from 1 μs MD simulation of LiRecDT1 in complex with SM. (A) Upper view of the representative structure of the complex. (B) Side view of the complex after removing the flanking α-helices and loops outside the active site for clarity. (C) Zoomed-in representation of the metal-binding center of LiRecDT1, SM, and the catalytic residues H12 and H47. In all cases, SM is represented as magenta balls and sticks, while the protein is shown in the cartoon. Secondary structure elements are colored differently (α-helices in red, β-strands in yellow, and loops in green). Intermolecular hydrogen bonds prevalent during the MD simulation are depicted as orange dashed lines. The coordination bonds are represented as dark dashed lines. Active site loops I and C are labeled, and waters coordinating the metal ion are indicated with the letter w. (D) Distributions of distances from the choline N atom to the centers of W230 (yellow) and Y228 (purple) aromatic rings, respectively, were calculated during the MD simulation. (E) Same as (D) but for the indicated P and O atoms of SM. PDF stands for probability density function. The first 100 ns of the MD simulation were discarded before analysis.

