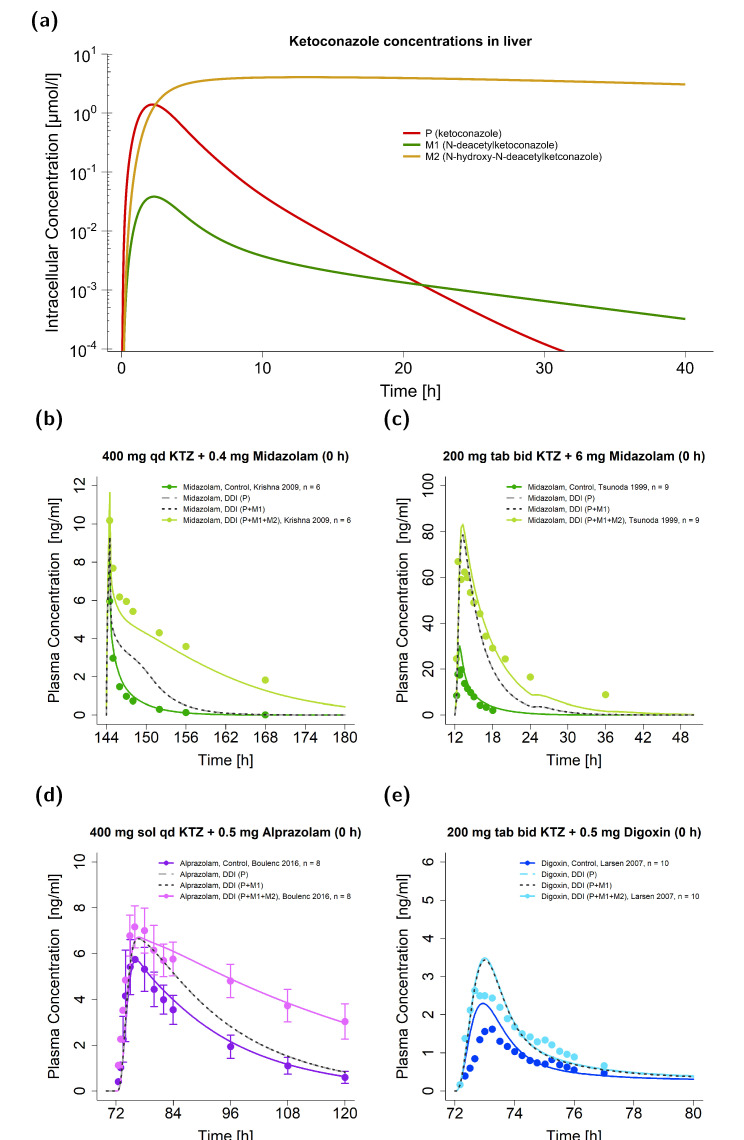
Figure 5.
Ketoconazole DDI model simulations without a dosing time gap between victim and perpetrator. Predicted intracellular concentrations in liver cells are illustrated for ketoconazole and its metabolites (M1 and M2) on a semi-logarithmic scale (a). Predicted compared to observed plasma concentration-time profiles are illustrated for DDIs with the victim drugs midazolam (b,c), alprazolam (d), and digoxin (e) [15,53,54,55]. Illustrated are DDI predictions (i) with the parent alone (P) (long dashed line in grey), (ii) with the parent and M1 (P + M1) (dashed line in black), and (iii) with the parent and both metabolites (P + M1 + M2) (solid line in a brighter colored shade) alongside their respective reference profile (solid line in a darker colored shade). Corresponding observed data are shown as dots (arithmetic mean ± standard deviation (if available)). Detailed information on the study protocols is provided in Table S3.7 in the Supplementary Materials. bid: twice daily; DDI: drug–drug interaction; KTZ: ketoconazole; M1: N-deacetylketoconazole; M2: N-hydroxy-N-deacetylketoconazole; n: number of participants; P: ketoconazole alone; qd: once daily; sd: single dose, sol: solution; tab: tablet.

