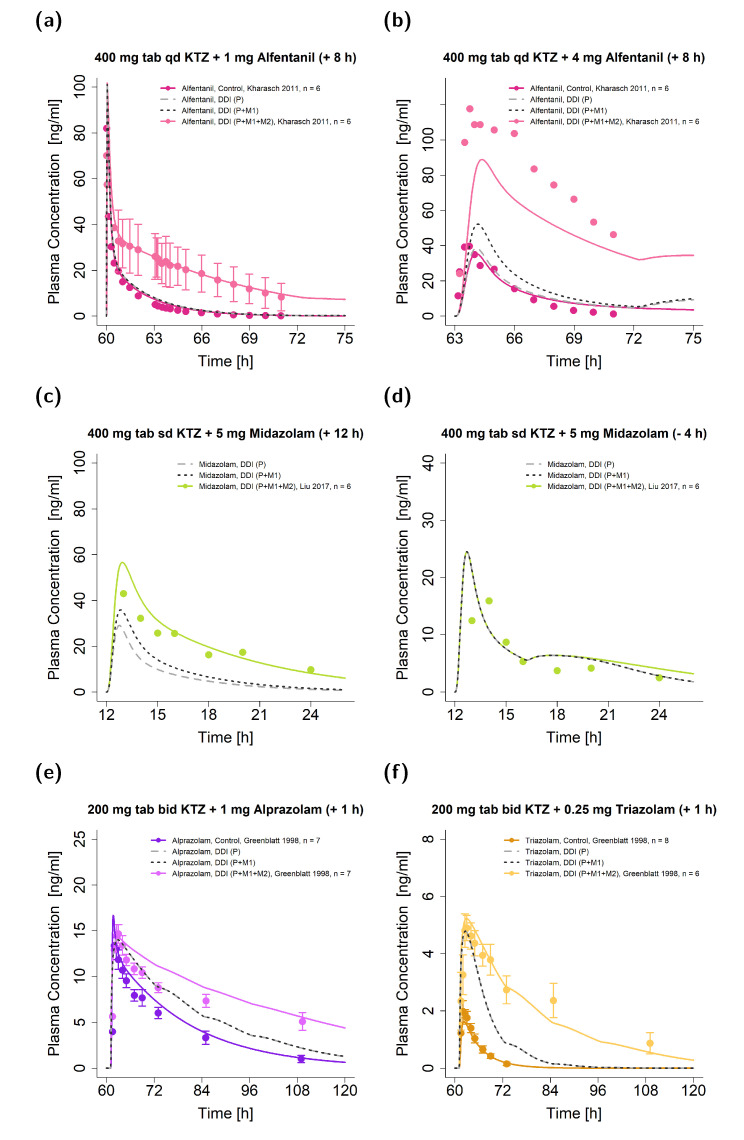
Figure 6.
Ketoconazole DDI model simulations. Predicted (as compared to observed) plasma concentration-time profiles are illustrated for DDIs with the victim drugs alfentanil (a,b), midazolam (c,d), alprazolam (e), and triazolam (f) [17,19,56]. The time of victim drug intake was 8 or 12 h after (a–c), 4 h before (d), and 1 h after (e,f) ketoconazole administration. Illustrated are DDI predictions (i) with the parent compound alone (P) (long dashed line in grey), (ii) with the parent compound and M1 (P + M1) (dashed line in black), and (iii) with the parent compound and both metabolites (P + M1 + M2) (solid line in a brighter colored shade) alongside their respective reference profiles (solid line in a darker colored shade). Corresponding observed data are shown as dots (arithmetic mean ± standard deviation (if available)). The dosing of ketoconazole–alfentanil DDIs (a,b) was normalized to the respective control to highlight the comparison of DDI and control, while the Supplementary Materials show the data from the respective studies that were simulated as described in their clinical trials reports for the DDI model evaluation and documentation [19]. Detailed information on the study protocols is provided in Table S3.7 in the Supplementary Materials. For the DDI studies illustrated in (c,d), no reference profiles were available. Note: bid: twice daily; DDI: drug–drug interaction; KTZ: ketoconazole; M1: N-deacetylketoconazole; M2: N-hydroxy-N-deacetylketoconazole; n: number of participants; P: ketoconazole alone; qd: once daily; sd: single dose; tab: tablet.

