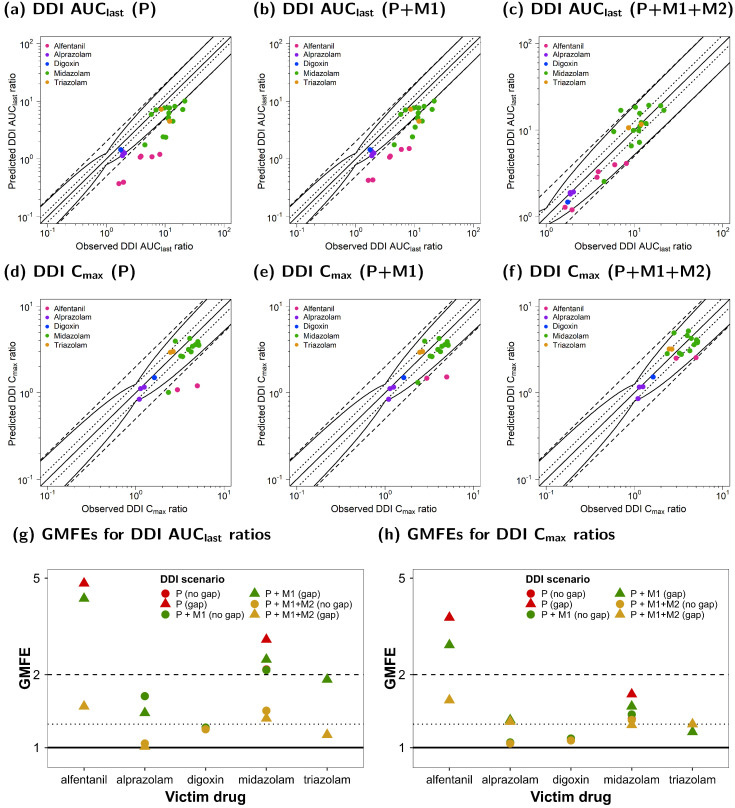
Figure 7.
Ketoconazole DDI model evaluation. Predicted DDI AUClast ratios of DDI simulations of three scenarios (P (a), P + M1 (b), and P + M1 + M2 (c)), as well as DDI Cmax ratios of three scenarios (P (d), P + M1 (e), and P + M1 + M2 (f)) were compared to the respective observed data. The straight solid line marks the line of identity, and the curved solid lines show the prediction acceptance limits proposed by Guest et al. (including 1.25-fold variability) [52]. Calculated mean GMFE values for DDI AUClast (g) and DDI Cmax ratios (h) for the three scenarios (P, P + M1, and P + M1 + M2) stratified according to victim with or without a dosing time gap between ketoconazole administration. Dotted lines indicate 1.25-fold and dashed lines indicate two-fold deviation. Detailed information on the study protocols is provided in Table S3.7 in the Supplementary Materials. AUClast: area under the plasma concentration-time curve calculated from the first to the last concentration measurement; Cmax: maximum plasma concentration; DDI: drug–drug interaction; GMFE: geometric mean fold error; KTZ: ketoconazole; M1: N-deacetylketoconazole; M2: N-hydroxy-N-deacetylketoconazole; P: ketoconazole alone.

