Figure 4.
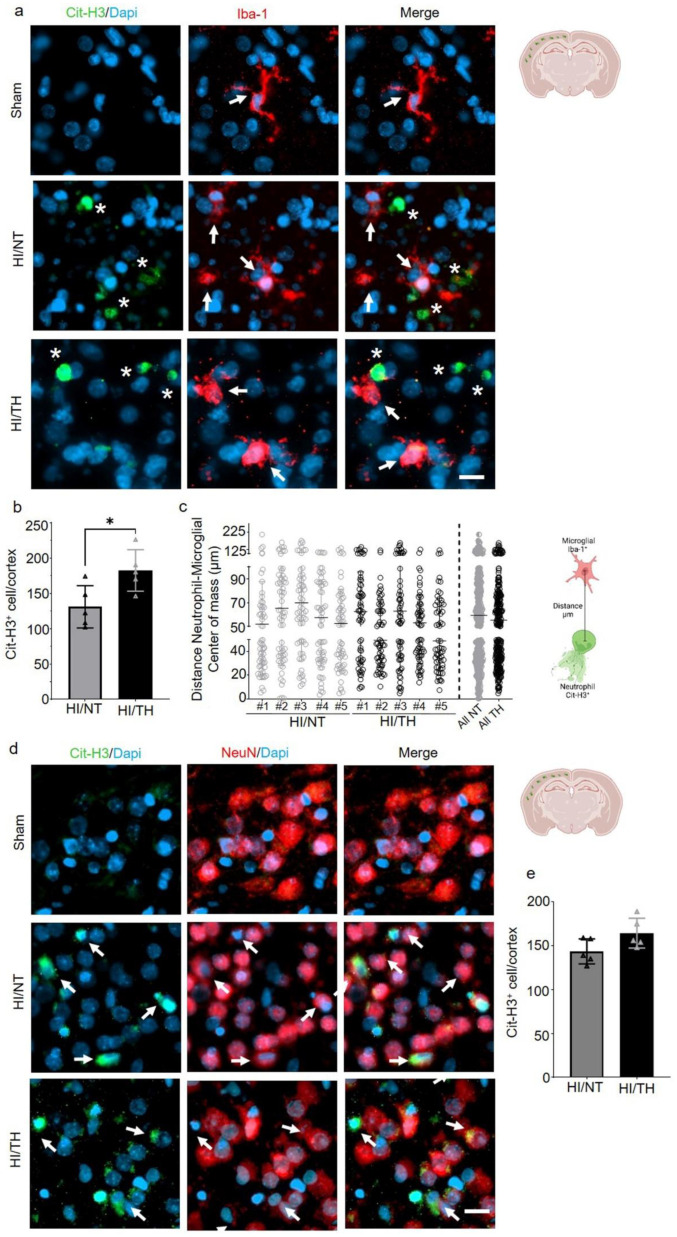
NETosis and its interactions with other cells in the brain after HI injury. Immunostaining was performed on brain slices at 24 h post-HI and representative images were taken from the cortex on the ipsilateral side of the brain. (a) Positive Cit-H3 cells in green show that the formation of NETosis was near positive microglial cells (red) in both NT and TH treatment groups. White arrows indicate positive Iba-1 microglial cells, while white asterisks indicate positive Cit-H3 NETs. Clear amoeboid and activated microglial cells were observed in the NT and TH groups, while ramified and resting microglia cells were observed in the sham group. The nuclear marker Dapi is shown in blue. (b) Quantitative analyses of the cortical area showing the number of positive Cit-H3 cells in the NT group (grey column) compared to the TH group (black column) (24 h after HI; data from five biological replicates (n = 5)). Student’s t-test was used with a * p < 0.05. Data are expressed as the mean ± SD. (c) Quantitative analyses 24 h after HI of the distance between the center of mass between neutrophil and microglial cells. #1–5 represent different animals. n = 5 with a total of 60 cells in the cortical areas per animal counted. Data are expressed as the mean ± SD. (d) Positive Cit-H3 cells (green) are proximal to positive NeuN cells (red) regardless of the treatment used: NT or TH. The nuclear marker Dapi is shown in blue. (e) Quantitative analyses of the cortical area showing the number of positive Cit-H3 cells in the NT group (grey column) compared to the TH group (black column) (24 h after HI; data from five biological replicates (n = 5)). Data are expressed as the mean ± SD. Images were taken with Axioscan microscope with an objective of 20×. Scale bar = 10 µm.

