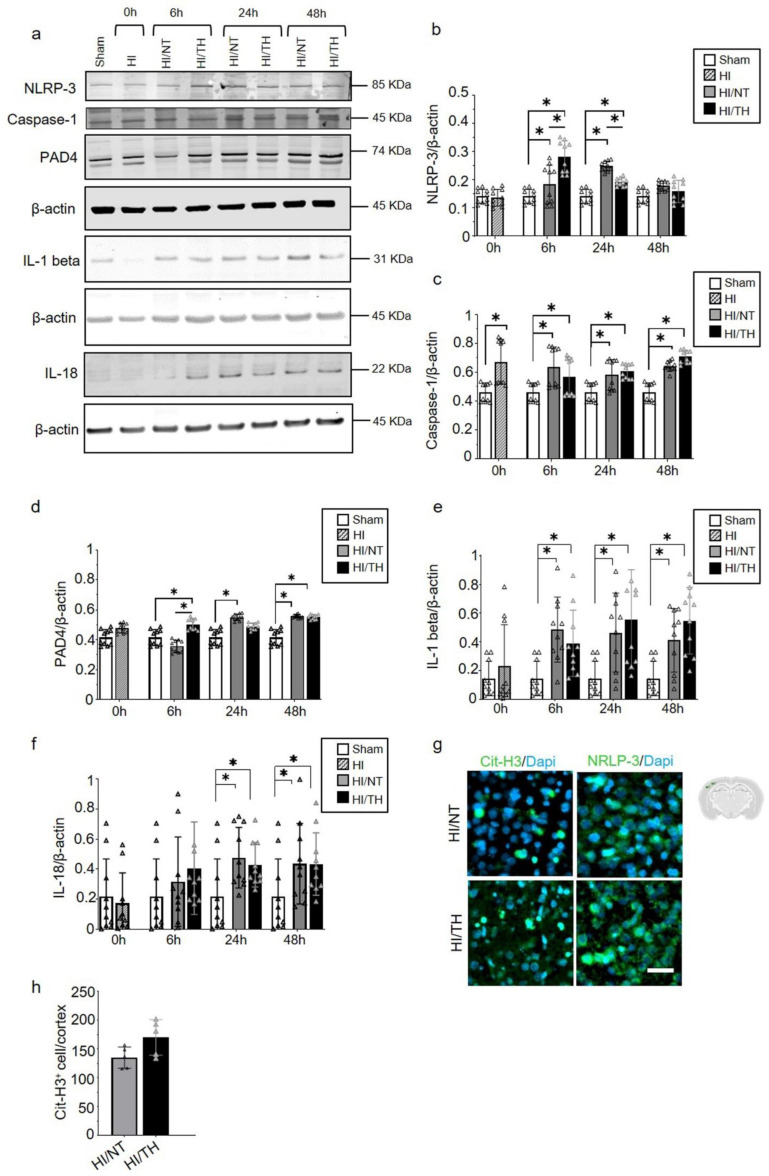
Figure 5.
Temporal induction of NETosis increased the expression of NLRP-3 inflammasome in ipsilateral brain samples after HI-NT or HI-TH treatment. Representative Western blotting images for all time points and conditions (a) for the NLRP-3 inflammasome marker, Caspase-1, IL-1beta, IL-18, and PAD4, and loading control β-actin. (b) Quantitative analysis of NLRP-3 inflammasome, (c) Caspase-1, (d) IL-1beta, (e) IL-18, and (f) PAD4 expression in neutrophils isolated from brain samples at the indicated time points after HI following NT or TH. Optical density was measured, and the ratio against the loading control β-actin was calculated. Data of ten biological replicates (n = 10) per time point and condition (see Section 4). Two-way ANOVA was used with a * p < 0.05. Data are expressed as the mean ± SD. (g) Representative images of positive NETosis in the cortical area from the ipsilateral side of the brain 24 h after HI in areas with strong NLRP-3-positive staining. The nuclear marker Dapi, in blue. Scale bar = 10 µm. Images were taken with Axioscan microscope, with an objective of 20×. (h) Quantitative analyses of the cortical area showing the number of positive Cit-H3 cells in the NT group compared to the TH group (24 h after HI; data from five biological replicates (n = 5)). Data are expressed as the mean ± SD. (b–f,h): sham (white column), HI (grey with cross-line column), HI/NT (grey column), and HI/TH (black column).

