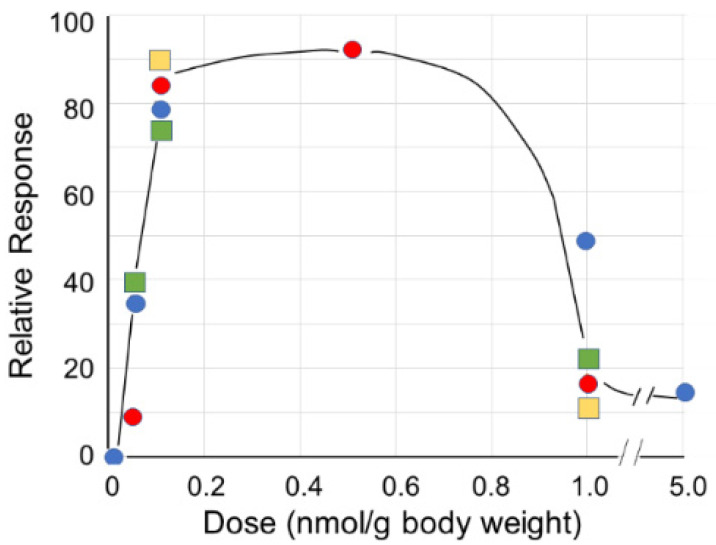
Figure 6.
Effect of dose on response in C57BL/6 mice. The peptides were injected subcutaneously, and measured endpoints included proliferation of progenitor peritoneal cells in healthy mice (red circles), inhibition of growth of glioma tumors with cells implanted into the brain (blue circles), and survival of mice with implanted ID8 ovarian cells treated with svL4 (green squares) or sv6D (yellow squares). The response curve reflects the extent of receptor occupancy, with greater than 50% leading to inhibition or tolerance.

