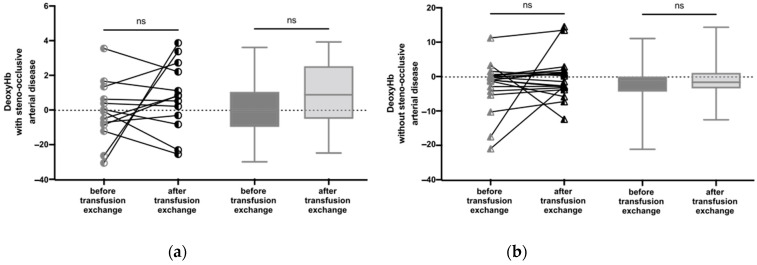
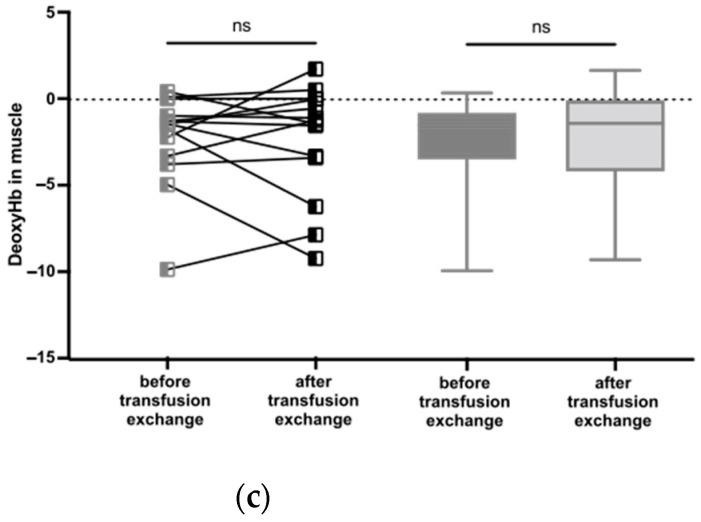
Figure A2.
Measurement of the relative amounts of DeoxyHb before and after BET. Box whisker plots show range, interquartile percentages, and median values for DeoxyHb. (a) DeoxyHb in cerebral hemispheres with steno-occlusive arterial disease (n = 13). ns using the Wilcoxon test. (b) DeoxyHb in cerebral hemispheres without steno-occlusive arterial disease (n = 19). ns using the Wilcoxon test. (c) DeoxyHb in muscle (n = 14). ns using the Wilcoxon test.


