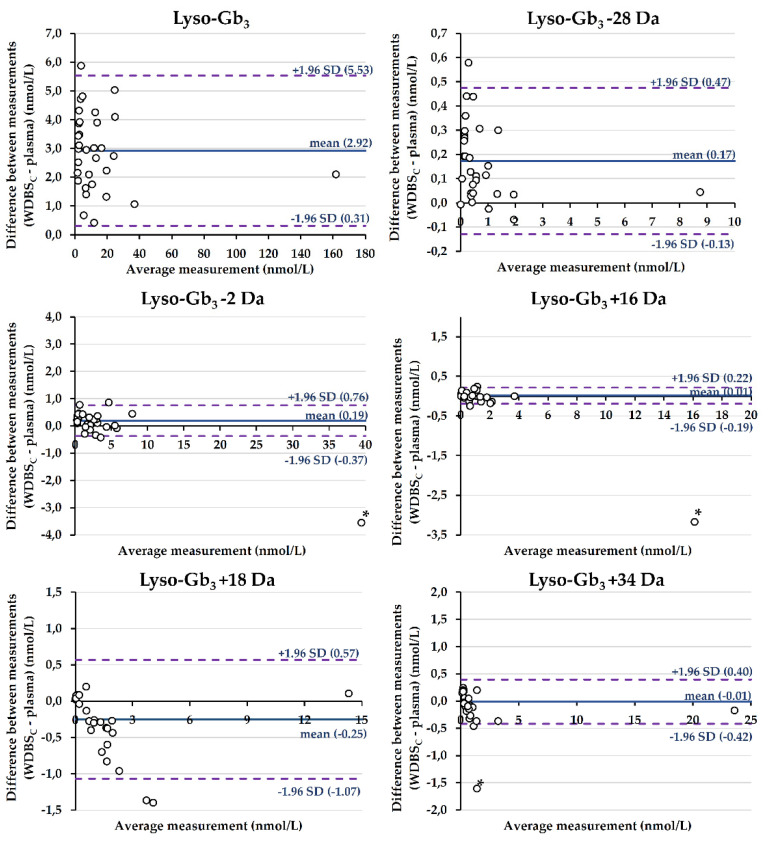
Figure 2.
Bland–Altman analyses between lyso-Gb3 and related analogue measurements in plasma and in DBSs collected using Whatman-GE 903 filter papers (capillary blood) (n = 32 participants). Mean differences are shown by solid lines, while the dashed lines represent the limits of agreement. For lyso-Gb3 −2 Da, lyso-Gb3 +16 Da, and lyso-Gb3 +34 Da, an outlier (*) was excluded from the calculations of the mean difference and 95% limits of agreement.

