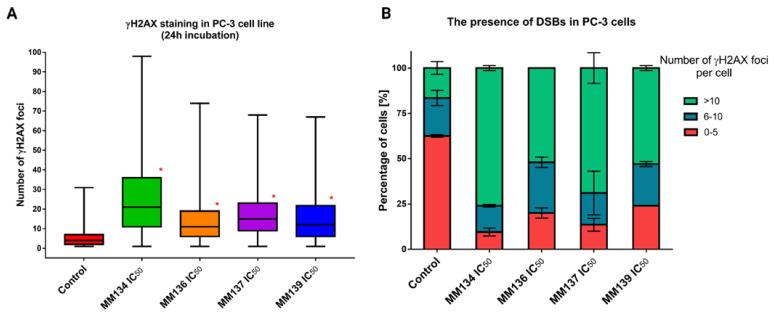
Figure 10.
γH2AX staining results in PC-3 cells: determination of DNA damage (double-strand breaks—DSBs) induced by IC50 concentrations of MM134, -6, -7, and -9 in PC-3 cancer cell line. (A) Data are represented as median γH2AX foci number per cell in each group with interquartile range and minimal and maximal values. The Kruskal–Wallis test was used to show a statistically significant difference between groups. Multiple comparisons using mean ranks for all groups module of Statistica software were used. In all groups, N > 200. * significant difference compared to the negative control (p < 0.05). (B) The graph presents the mean (±SD) percentage of cells that have a defined number of γH2AX foci in the sample.

