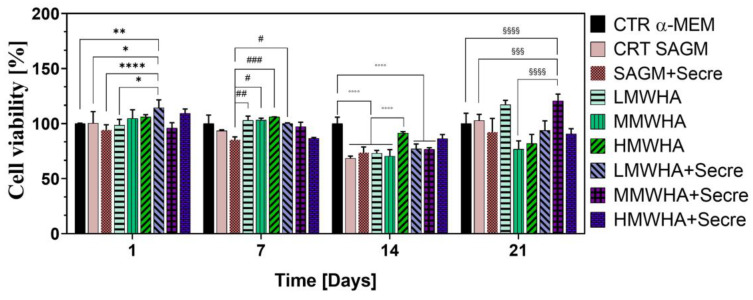
Figure 3.
Cell viability performed by Alamar blue test. Viability percentage as function of time at 1, 7, 14 and 21 days of cell culture during the differentiation test. For each evaluated day of culture, all samples’ viabilities are referred to CTR α-MEM as control at that specific day. * p value < 0.05, ** p value < 0.01, **** p value < 0.0001; # p value < 0.05, ## p value < 0.01, ### p value < 0.001; °°°° p value < 0.0001; §§§ p value < 0.001, §§§§ p value < 0.0001.

