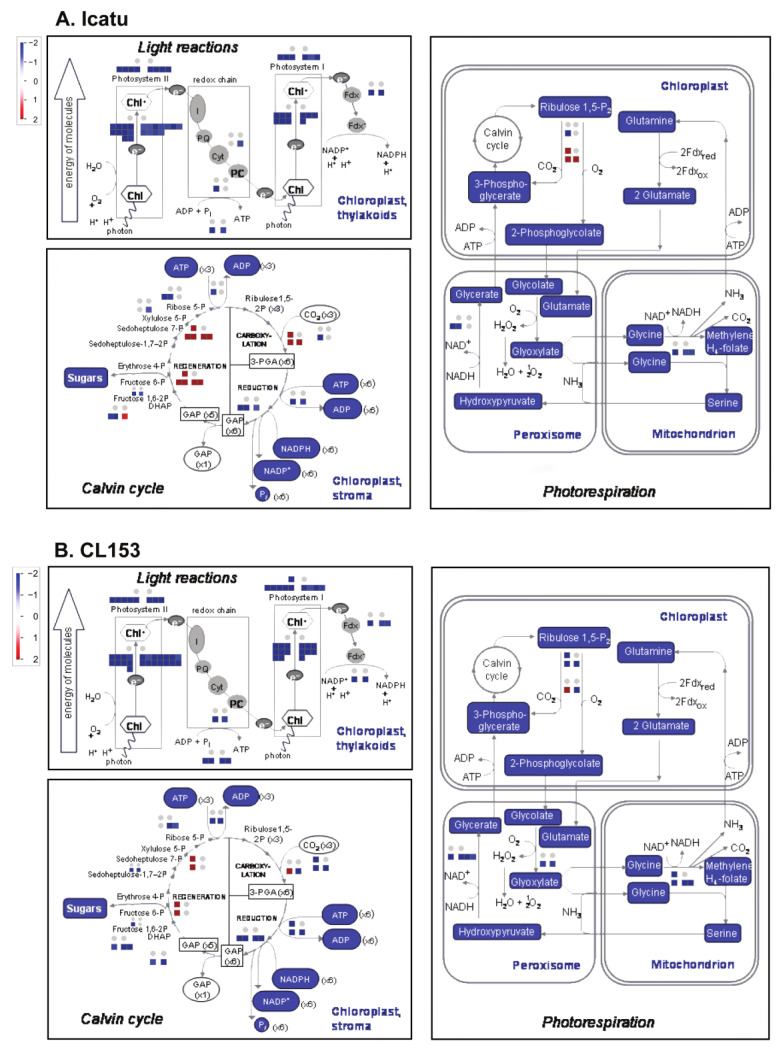
Figure 4.
Changes in the expression of photosynthesis-related DEGs in (A) Icatu and (B) CL153 plants grown under MWD or SWD in comparison with WW plants grown under aCO2 or eCO2, at 25/20 °C (day/night). Pathway diagrams of light reactions of photosynthesis, the Calvin cycle, and photorespiration with superimposed color-coded squares drawn in MapMan. The color scale represents the level of regulation (blue: down-regulated DEGs; red: up-regulated DEGs). Results in the squares are presented in the following order: top left—MWD-aCO2; top right—MWD-eCO2; bottom left—SWD-aCO2; bottom right—SWD-eCO2. Grey dots represent an absence of DEGs. An absence of data in eCO2 indicates the absence of DEGs.

