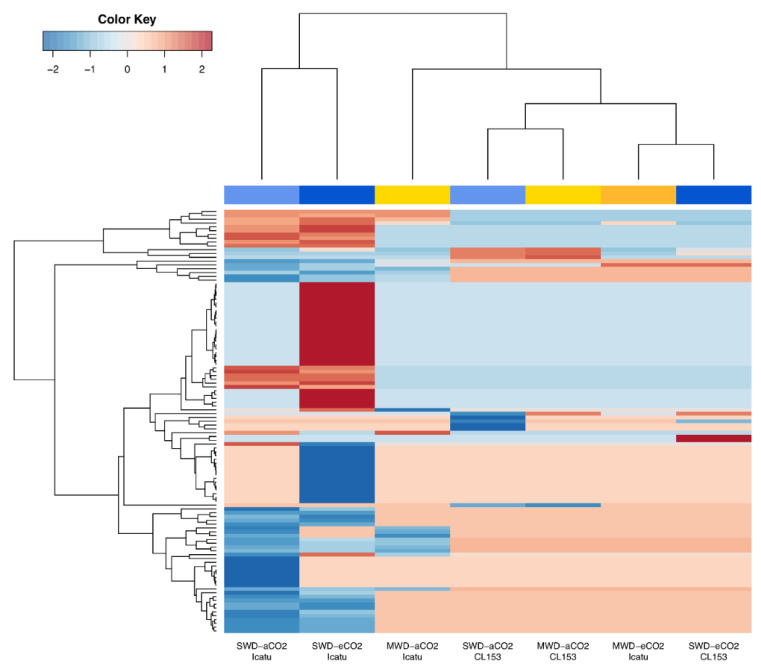
Figure 5.
Clustered heatmaps and dendrograms of the normalized log2 fold change (FC) visualizing the expression of drought-related DEGs in Icatu and CL153 plants grown under MWD or SWD in comparison with WW plants grown under aCO2 or eCO2, at 25/20 °C (day/night). Values were scaled by row using Z-scores. Hot colors represent up-regulated DEGs, and cold colors represent down-regulated DEGs. Column color labels groups comparisons by water treatments (yellow/orange: MWD; light blue/dark blue: SWD; light colors represent aCO2; dark colors represent eCO2). An absence of data in CL153 plants under MWD-eCO2 indicates the absence of significant DEGs.

