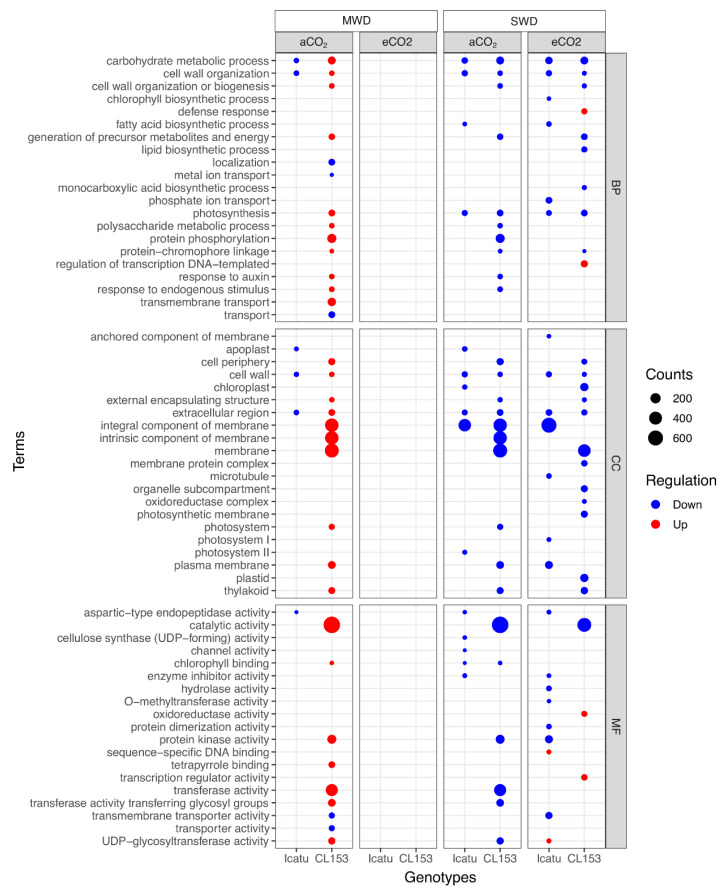
Figure 6.
Over-representation analysis of gene ontology (GO) terms found among Icatu and CL153 DEGs performed with gProfiler against the functional annotation of Coffea arabica and Coffea canephora genomes, respectively. Significantly (g:SCS < 0.01) enriched GO was ranked by decreasing log2 fold-change (FC), considering the effect of MWD or SWD in comparison with WW plants grown under aCO2 or eCO2, at 25/20 °C (day/night). Dot plots with all GO terms were filtered by REVIGO with similarity = 0.5, and a count > 10 cut-offs. Terms are grouped by the main category: Biological Process (BP), Molecular Function (MF), and Cellular Component (CC). Counts (size) indicate the number of DEGs annotated with each GO term and color represents the type of regulation (blue: down-regulated DEGs; red: up-regulated DEGs). An absence of data in eCO2 under MWD indicates the absence of enriched GO terms.

