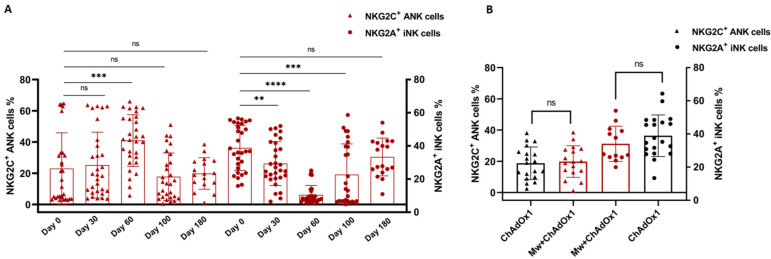
Figure 2.
Adaptive NK (ANK) cells and inhibitory NK (iNK) cells: Scatter dot with bar plot showing (A) the kinetics of NKG2C+ ANK and NKG2A+ iNK cells in Mw + ChAdOx1 group at baseline, day 30, day 60, day 100 and day 180. (B) Expression of NKG2C+ ANK and NKG2A+ iNK cells between Mw + ChAdOx1 and ChAdOx1 group at the time of enrolment. Red shaded triangles and dots represent NKG2C+ ANK and NKG2A+ iNK, respectively, for Mw + ChAdOx1 group. Black shaded triangles and dots represent NKG2C+ ANK and NKG2A+ iNK, respectively, for ChAdOx1 group. ** p < 0.01, *** p < 0.001, **** p < 0.0001 and ns = p-value not significant.

