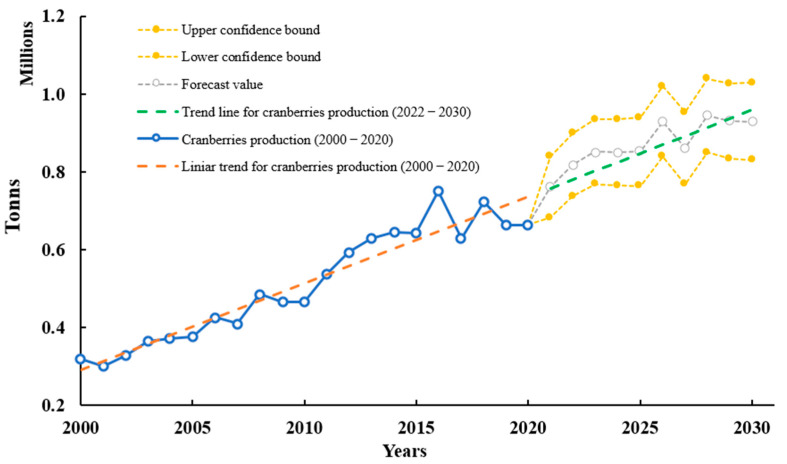
Figure 2.
Evolution of world cranberry production over time. According to FAO, global cranberry production (tons) from 2000 until 2030 and TREND production until 2030. The trendline was calculated considering cranberry production every year from 2000–2020. The TREND function returns values along with a linear trend. It fits a straight line (using the least squares method) to the arrays known_ys and known_xs. TREND returns the y–values along that line for the array of new_xs that you specify.

