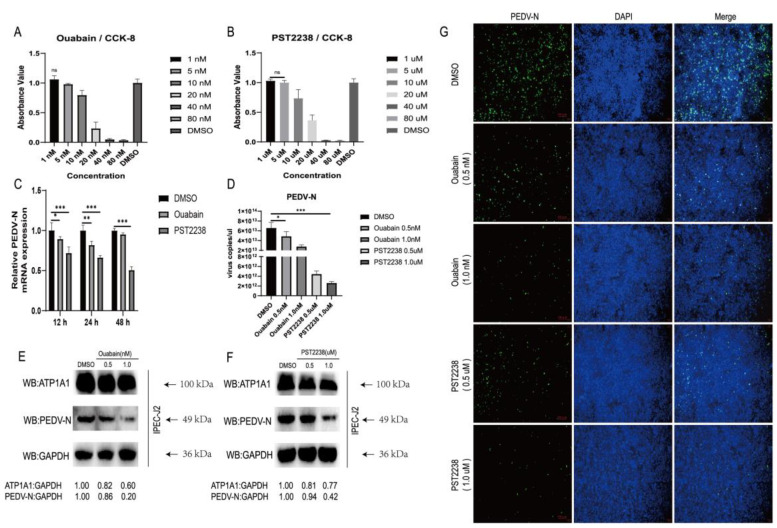
Figure 4.
NKA inhibitors promote internalization and degradation of ATP1A1 and effectively reduce PEDV infection. (A,B) The cytotoxicity of Ouabain and PST2238. IPEC-J2 cells were treated with 1.0, 5.0, 10.0, 20.0, 40.0, 80.0 nM Ouabain and 1.0, 5.0, 10.0, 20.0, 40.0, 80.0 μM PST2238 for 48 h; DMSO was used as control. The treated cells were then analyzed using the CCK-8 kit. Data represent means ± SD from three independent experiments. ns, no significant difference. (C) Treatment with Ouabain or PST2238 downregulates PEDV RNA abundance. IPEC-J2 cells were grown to 90% confluency, and 1.0 nM Ouabain or 1.0 μM PST2238 viral medium (0.1 MOI) was used to infect the cells for 1 h. After washing the cells with PBS, the maintenance solution containing the above concentrations of drugs was added to continue the culture. Cells were collected at 12, 24 and 48 h for viral RNA quantification. Data represent means ± SD from three independent experiments. *, p < 0.05; **, p < 0.01; ***, p < 0.001. (D) Treatment with Ouabain or PST2238 suppresses PEDV RNA abundance in a dose-dependent manner. Virus cultures containing 0.5, 1.0 nM Ouabain or 0.5, 1.0 μM PST2238 were infected with cells for 1 h. The virus-containing medium (0.1 MOI) was replaced with a growth medium containing the corresponding concentration of drugs for 24 h. Extraction of cellular RNA for quantitative PCR assay. *, p < 0.05; ***, p < 0.001. (E,F) Treatment with Ouabain or PST2238 decreases PEDV N protein expression in a dose-dependent manner. Cells were treated in the same way as in Figure 4D and then cultured for 48 h. Cells lysates were prepared for Western blot analysis. (G) Treatment with Ouabain or PST2238 inhibits PEDV replication in a dose-dependent manner. Cells were treated in the same way as in Figure 4D and then cultured for 48 h. After fixation, penetration and closure of cells, staining with anti-PEDV-N mAb (green) and cell nuclei using DAPI (blue) staining solution. The processed samples were photographed and analyzed using fluorescence microscopy. Scale bars, 100 μm.

