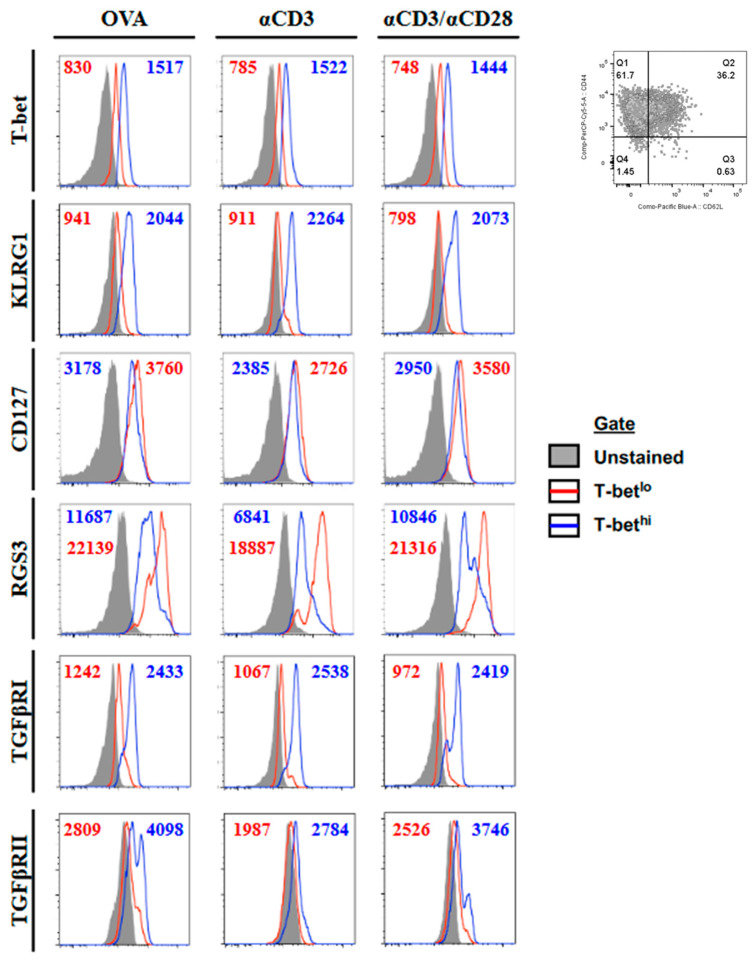
Figure 1.
Phenotype of T-bethi and T-betlo effector CD8 T cells. OT-I splenocytes were activated in vitro for 5 days with either OVA257, anti-CD3ε mAb, or anti-CD3ε and anti-CD28 mAbs. Cells were gated on CD8 CD44hi (upper right) and T-bethi or T-betlo (gated from T-bet vs. CD8 plot). Histograms demonstrate the expression levels of T-bet, KLRG1, CD127, TGFβRI, TGFβRII, and RGS3 in unstained controls (gray-filled histograms) and T-betlo (red line) and T-bethi (blue line) CD8 effector T cells. Mean fluorescence intensities are shown for T-betlo (red text) and T-bethi (blue text) CD8 T cells for each plot. The data shown are representative of at least three individual experiments with similar results.

