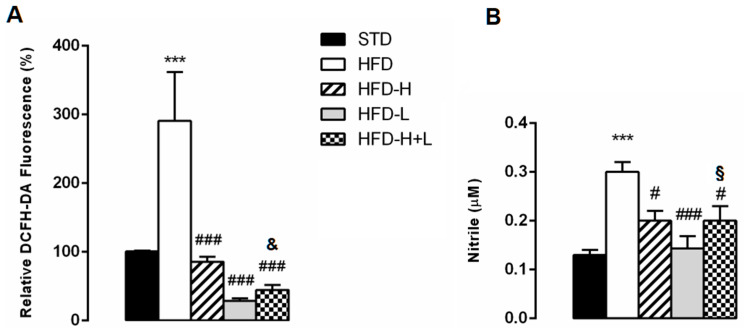
Figure 6.
Brain oxidative stress. (A) Levels of ROS in the brain of STD, HFD, HFD-H, HFD-L and HFD-H + L mice. (B) Nitrite concentration in the brain of STD, HFD, HFD-H, HFD-L and HFD-H + L mice. Data are mean values ± S.E.M. (n = 8/group). *** p < 0.001 vs. STD mice; # p < 0.05, ### p < 0.001 vs. HFD mice; & p < 0.05 vs. HFD-H mice; § p < 0.05 vs. HFD-L mice.

