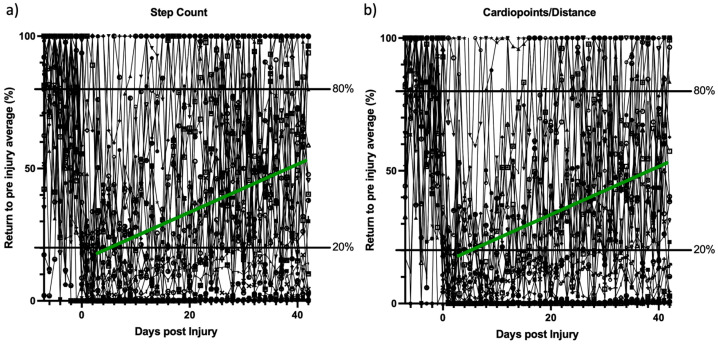
Figure 3.
(a) shows the pre- and post-injury patient recovery process, as continuously tracked by the daily step-count over 6 weeks. (b) shows the pre- and post-injury patient recovery process, as continuously tracked by the most common other available smartphone activity outcomes (Apple: Distance; Android: Cardiopoints) over 6 weeks. All values were normalized to the average individual activity 7 days prior to injury and capped at 100% for better visualization. The X-axis shows the time in days (0 = day of injury), while the Y-axis shows the normalized activity metric. The horizontal lines show the lower 20% and upper 80% border. The green line represents a drawn trend line of patients recovering during the first 6 weeks.

