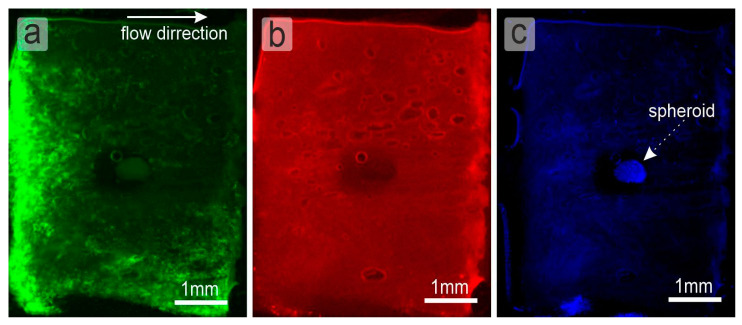
Figure 3.
Fluorescence microphotograph of the LNOC during experiment. (a) Green fluorescence are Jurkat cells (Calcein AM). (b) Red fluorescence are polymer capsules (Cy5). (c) Blue fluorescence is 4T1 cellular spheroid (Hoechst). Flow direction is shown in the (a) by the white arrow (from left to right).

