Figure 4.
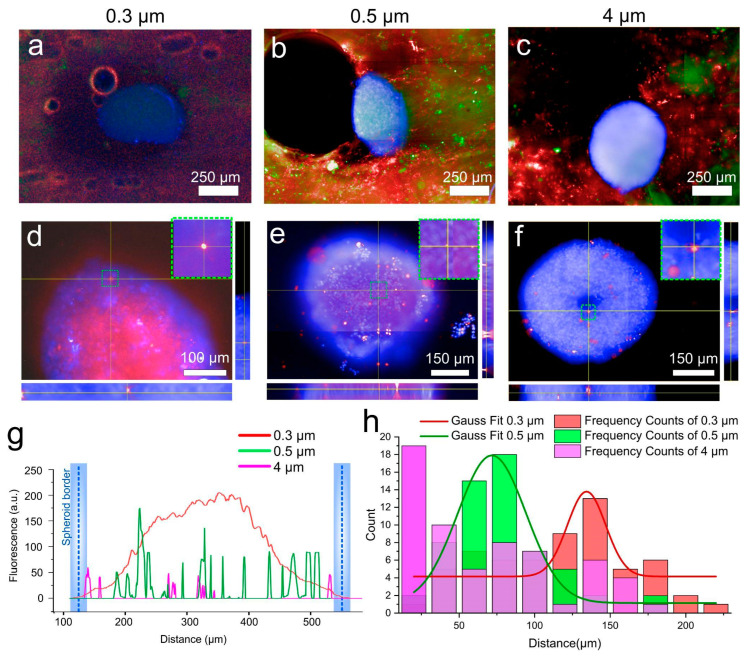
(a–c) Fluorescence images of chip with 4T1 cell tumor spheroid (Hoechst, blue fluorescence), T lymphocyte cells (Calcein Am, green fluorescence), and (a) 0.3, (b) 0.5 and (c) 4 µm polymer capsules (Cy5, red fluorescence). (d–f) Orthogonal fluorescence images of cell spheroids with internalized (d) 0.3, (e) 0.5 and (f) 4 µm capsules. (g) Photographed fluorescence profiles for cell spheroids with internalized capsules of 0.3, 0.5 and 4 µm. The fluorescence brightness profile along the dashed yellow line in (d–f), which shows the fluorescence distribution of capsules 0.3 (red), 0.5 (green), and 3.5 (purple) in the cell spheroid, the borders of which are marked with blue. (h) The distribution of the capsule’s penetration depth.

