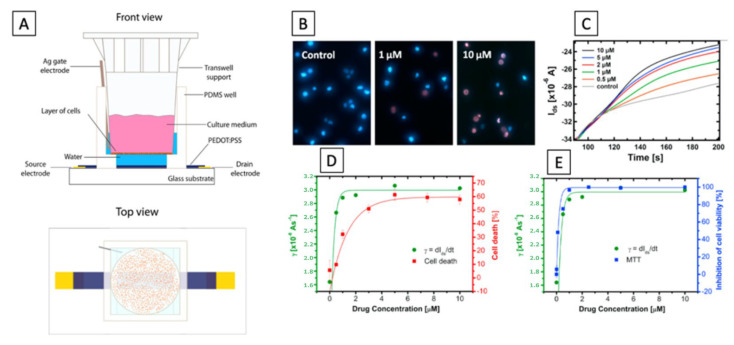
Figure 9.
(A): Schematic of the front view and top view of a Tweel OECT. (B): Representative images of the fluorescence assay and the increasing doxorubicin concentration. The number of dead cells increase, increasing the drug concentration. (C): Kinetics of the source/drain current as a function of doxorubicin concentration. (D,E): Comparison between calculated γ parameter and results from the fluorescence and MTT assay [121].

