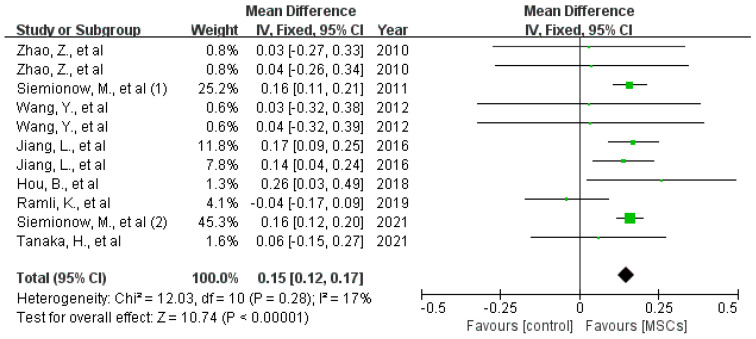
Figure 8.
The forest plot shows the effect of MSCs on myelin thickness (middle and distal parts of the nerve defects) 12 weeks after surgery [5,11,12,13,14,15,16,17,18,19,20,21,22,23,24,25,26,27,28,29,30,31,32,33,34,35,36]. Plots on the left-hand side indicate favoring MSCs or MSCs-loaded scaffolds, while plots on the right side indicate favoring placebo-control treatment or blank scaffolds.

