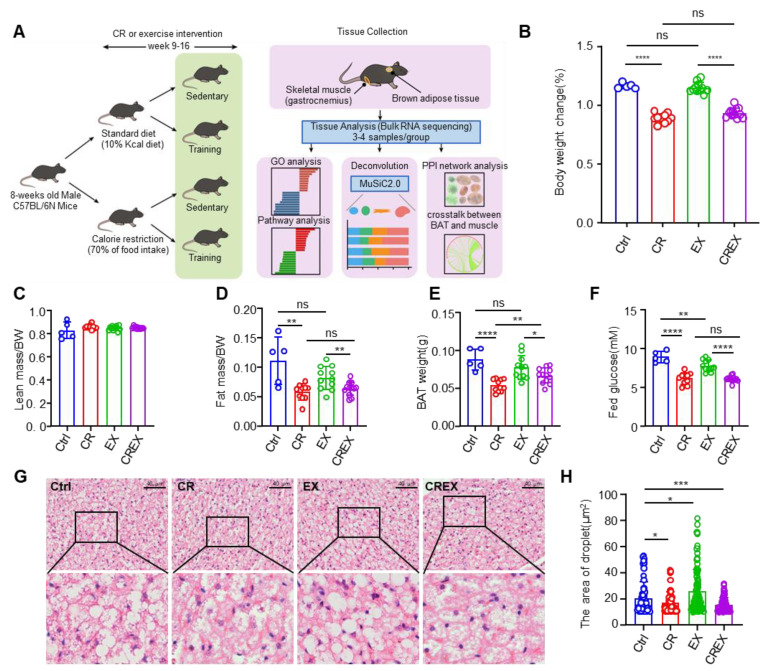
Figure 1.
Study overview and phenotypic responses. (A) Overview of the mouse study and tissue profiling. (B–F) Body weight change (B), ratio of lean mass to body weight (C), ratio of fat mass to body weight (D), BAT weight (E) and fed glucose (F) in the four intervention groups. (G) Representative hematoxylin and eosin staining images of BAT (scale bars, 40 μm). (H) Areas of the droplets from H&E staining images of BAT. Statistical comparisons were carried out using unpaired one-tailed t tests or Wilcoxon rank sum and signed rank tests (B–F,H). Data are represented as means ± SD. * p < 0.05, ** p < 0.01, *** p < 0.001,**** p < 0.0001; ns, not significant; BW, body weight; CR, calorie restriction; EX, exercise training; CREX, calorie restriction combined with exercise training; BAT, brown adipose tissue.

